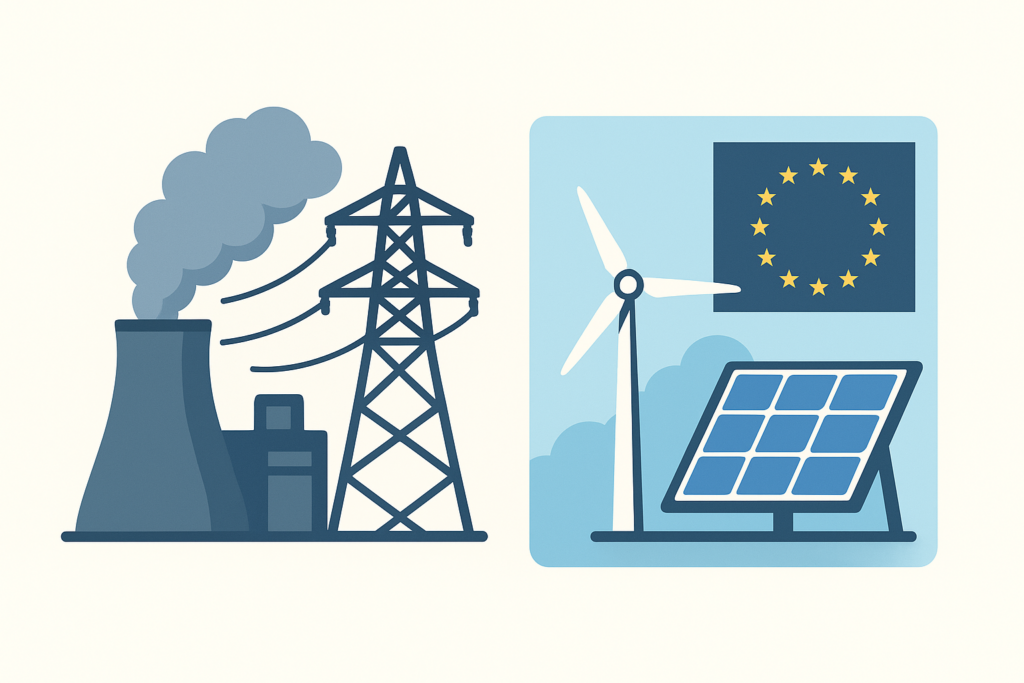
EU ETS Dashboard
Our dashboard helps you navigate the emissions data covered by the EU Emissions Trading system at various granularity levels.
Explore the emissions per year by sector, and compare historical allowances covered by auctions, offsets and free allocations from 2005 to 2023.
What does the dashboard show?
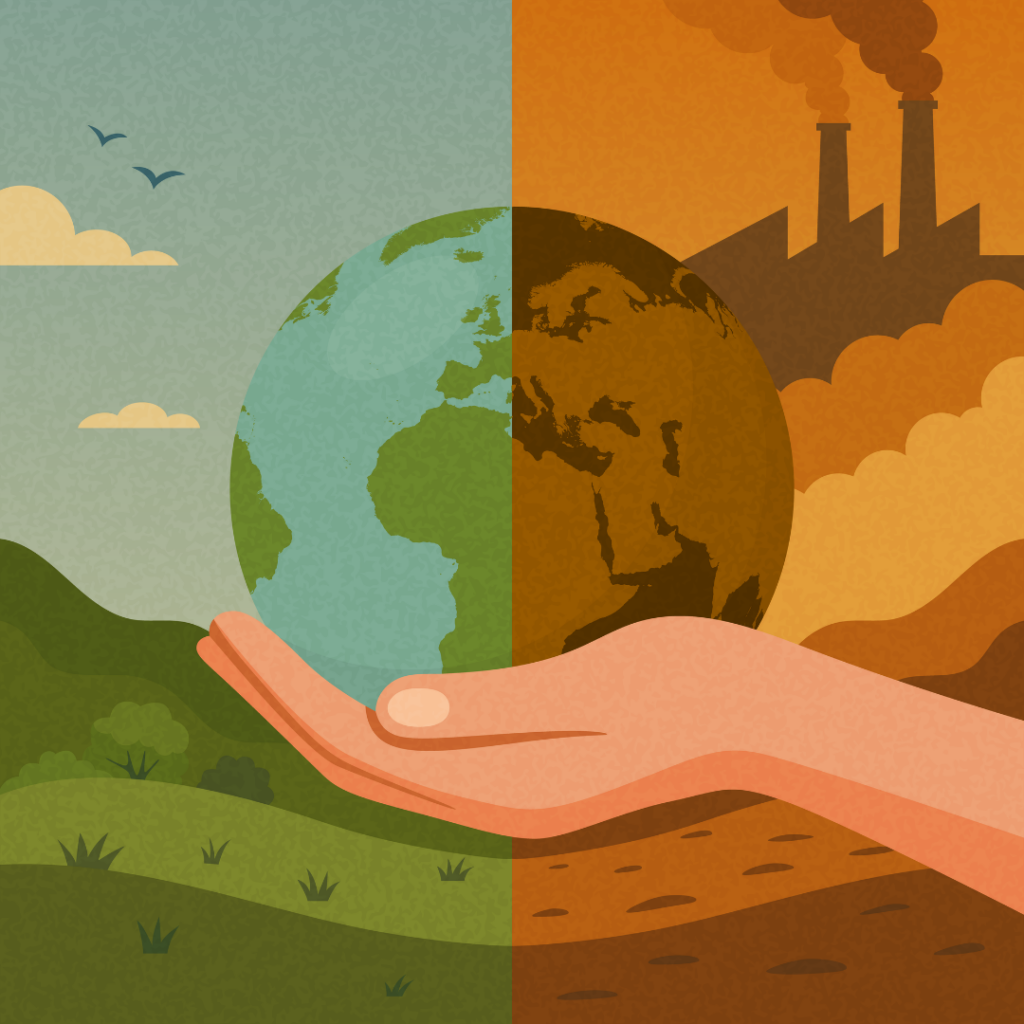
The dashboard provides three key insights. It shows the historical evolution of carbon dioxide (CO2) emissions over time by two different sector categorisations, giving a clear picture of how much each sector or subsector has contributed to overall emissions each year and helping to identify trends and patterns. It also presents the installation distribution, highlighting where emissions come from across Europe by displaying individual installations, with each one color-coded by sector and sized according to the previous year’s emissions. Additionally, the sector details section breaks down emissions and free allowances, showing how much CO2 was emitted and how much was covered by free allowances, offering a deeper look into the balance between emissions and free allowances. This way, the dashboard helps users better understand how different sectors contribute to the EU Emissions Trading System (EU ETS).
How can I use this dashboard?
The dashboard can be used by selecting one of two sector categorisations: the EUTL sectors based on the EUTL main activities, or a custom version developed by Sandbag. In the Sandbag categorisation, the power and heat sectors are separated, and the iron and steel sector has been enhanced to include installations from other sectors within the steel value chain. Based on the chosen categorisation, the charts will automatically update, displaying the historical evolution of CO2 emissions, the distribution of installations across Europe, and detailed sector-level insights on emissions and free allowances. Additional filters can be applied to further refine the data by subsector, providing a more specific view of the selected sector. More information about these categorisations is provided within the dashboard.
Where does the data come from?
Most of the data used in the dashboard is sourced from the European Union Transaction Log (EUTL). However, the way sectors and subsectors are defined varies depending on the categorisation. For Sandbag sectors, subsectors generally align with NACE categories where available, based on the main activity of the installation. For example, an installation containing both BF-BOF and a coke oven might be classified solely as “BF-BOF.” NACE data are further supplemented by information from various sources, including the EUTL, JRC Open Power Plants Database (JRC-PPDB), and company websites. In contrast, for EUTL sectors, subsectors are directly based on the “Main Activity” field from the EUTL data.
Related Publications
Sandbag responds to Thyssenkrupp
Our technical brief on how the ETS is a net benefit for European steelmakers was covered by ESG.Table, alongside a response from Thyssenkrupp Steel, which raised three objections. This response analyses the German steelmaker’s claims.
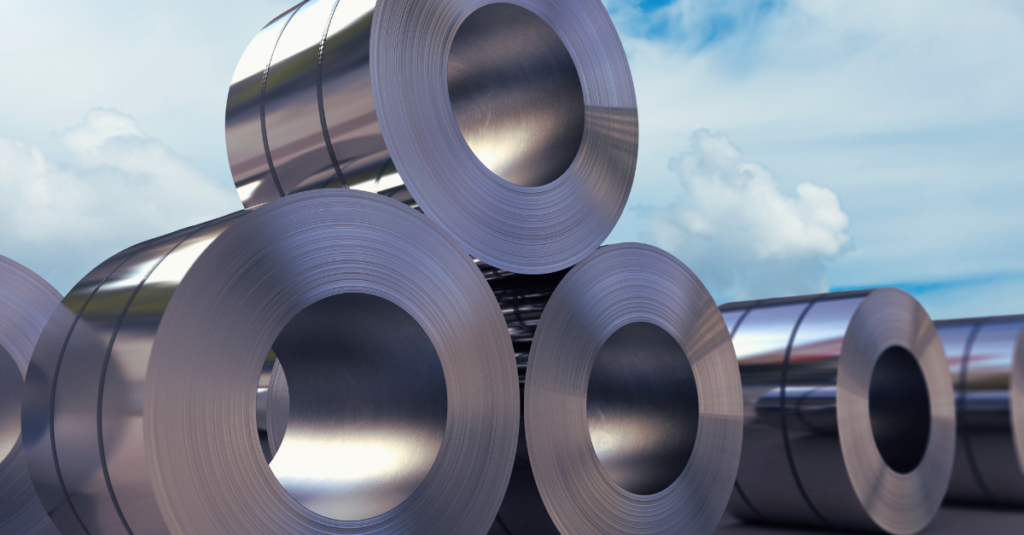
EU steelmaking: the ETS money is coming!
This brief challenges recent industry claims that EU steelmakers are being harmed by the EU’s Emissions Trading System and finds that the opposite is true.
EU ETS Reform: Let’s not invalidate climate policy!
Based on our updated EU ETS simulator, this technical brief models the impact of the several proposals on the carbon market’s supply/demand balance under the European Commission’s impact assessment emission scenarios.
Improving EU ETS benchmarks: Response to the European Commission’s public consultation on EU ETS benchmarks
Sandbag’s response to the public consultation on the European Commission’s proposed revision of the benchmark values of free allocation of emission allowances (2026-2030).
Rhetoric vs reality: setting the record straight on the impact of the EU ETS on industrial competitiveness
This brief examines whether the claims by Czechia and Italy that the EU ETS is responsible for declining industrial competitiveness hold up to scrutiny.
Don’t Ruin the EU ETS! Joint NGO Letter to the European Council
Ahead of the March European Council meeting, we’ve joined a group of 35 civil society organisations calling on EU leaders to protect the integrity of the EU Emissions Trading System.
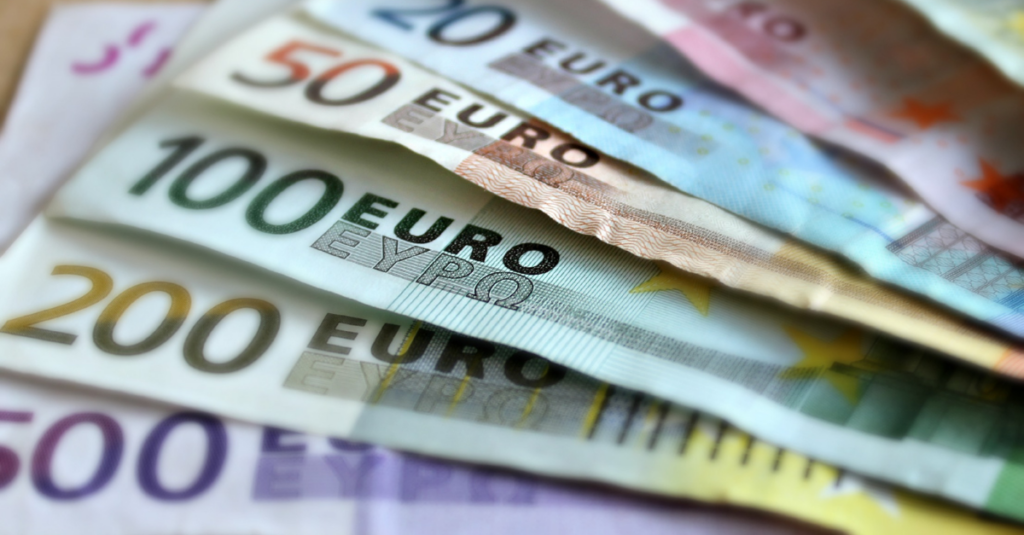
ICC reform and expansion risks diverting ETS revenues from real climate action
Sandbag and 14 other organisations urge the European Commission to reform, not expand, the ETS Indirect Cost Compensation scheme — warning that current proposals risk diverting climate funding into untargeted fossil subsidies.
State Aid for Indirect Carbon Costs: Reform before extending!
Sandbag responds to the EU’s consultation on State aid for Indirect Carbon Costs (ICC), calling for targeted reforms to better support clean electricity, avoid windfall profits, and align with the Carbon Border Adjustment Mechanism (CBAM).
Simulating CDR in the EU ETS: The Risks of Premature Integration
Sandbag has developed an ‘ETS + CDR simulator’ to help visualise and explore the impact that CDR integration could have on the ETS, assess the demand it could create for CDR, and highlight the potential consequences of this demand. This report uses the simulator to explore how different integration pathways could affect emissions reductions, carbon prices, and potentially lead to negative externalities.
The EU ETS at a Crossroads
Sandbag’s latest submission to the EU ETS and Innovation Fund consultation calls for clearer rules on free allocation, stronger criteria for funding innovation, and safeguards against misleading carbon accounting practices.

Mundo Matogné. Rue d’Edimbourg 26, Ixelles 1050 Belgium. Sandbag is a not-for-profit (ASBL) organisation registered in Belgium under the number 0707.935.890. EU transparancy register no. 277895137794-73. VAT: BE0707935890