
Carbon Price Viewer
Explore historic carbon price trends under the EU Emissions Trading System (EU ETS)This Carbon Price Viewer shows the cost of emitting one tonne of Carbon Dioxide in Europe up to April 2026.

Questions and answers
How can I use the Carbon Price Viewer?
The Carbon Price Viewer lets you see historical variations in the carbon price since the beginning of the second phase of the ETS in 2008, or over a shorter period by “zooming” into any time interval.
What does the Carbon Price Viewer show?
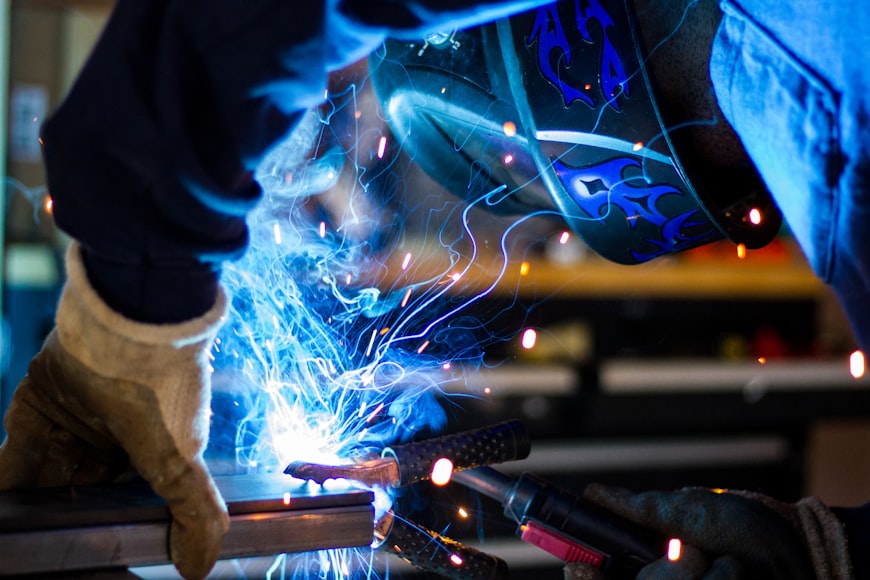
The Carbon Price Viewer shows the historical price of European allowances (EUA), i.e. the price of emitting 1 tonne of CO2-equivalent for a European industrial installation or airline covered by the Emissions Trading System. It does not mean that this price is always paid by polluters, as many of them receive free allowances.
EUAs are traded between buyers and sellers, either directly “over the counter” or via organised markets. They can be traded either with immediate delivery (spot) or with delivery in the future, usually at slightly different prices. Up until December 2009, the price shown is based on spot-month continuous contract calculation. After that date, it corresponds to auction settlement prices, from the European Energy Exchange AG.
Where does the data come from?
Up until December 2009, the price was sourced from Quandl. Since then, the data has been sourced from ICAP.
Related Publications
Read more about the drivers of the carbon price in the EU ETS in our report on supply and demand in the EU ETS.
Sandbag responds to Thyssenkrupp
Our technical brief on how the ETS is a net benefit for European steelmakers was covered by ESG.Table, alongside a response from Thyssenkrupp Steel, which raised three objections. This response analyses the German steelmaker’s claims.
EU steelmaking: the ETS money is coming!
This brief challenges recent industry claims that EU steelmakers are being harmed by the EU’s Emissions Trading System and finds that the opposite is true.
EU ETS Reform: Let’s not invalidate climate policy!
Based on our updated EU ETS simulator, this technical brief models the impact of the several proposals on the carbon market’s supply/demand balance under the European Commission’s impact assessment emission scenarios.
Improving EU ETS benchmarks: Response to the European Commission’s public consultation on EU ETS benchmarks
Sandbag’s response to the public consultation on the European Commission’s proposed revision of the benchmark values of free allocation of emission allowances (2026-2030).
Rhetoric vs reality: setting the record straight on the impact of the EU ETS on industrial competitiveness
This brief examines whether the claims by Czechia and Italy that the EU ETS is responsible for declining industrial competitiveness hold up to scrutiny.
Don’t Ruin the EU ETS! Joint NGO Letter to the European Council
Ahead of the March European Council meeting, we’ve joined a group of 35 civil society organisations calling on EU leaders to protect the integrity of the EU Emissions Trading System.
ICC reform and expansion risks diverting ETS revenues from real climate action
Sandbag and 14 other organisations urge the European Commission to reform, not expand, the ETS Indirect Cost Compensation scheme — warning that current proposals risk diverting climate funding into untargeted fossil subsidies.
State Aid for Indirect Carbon Costs: Reform before extending!
Sandbag responds to the EU’s consultation on State aid for Indirect Carbon Costs (ICC), calling for targeted reforms to better support clean electricity, avoid windfall profits, and align with the Carbon Border Adjustment Mechanism (CBAM).
Simulating CDR in the EU ETS: The Risks of Premature Integration
Sandbag has developed an ‘ETS + CDR simulator’ to help visualise and explore the impact that CDR integration could have on the ETS, assess the demand it could create for CDR, and highlight the potential consequences of this demand. This report uses the simulator to explore how different integration pathways could affect emissions reductions, carbon prices, and potentially lead to negative externalities.
The EU ETS at a Crossroads
Sandbag’s latest submission to the EU ETS and Innovation Fund consultation calls for clearer rules on free allocation, stronger criteria for funding innovation, and safeguards against misleading carbon accounting practices.

Mundo Matogné. Rue d’Edimbourg 26, Ixelles 1050 Belgium. Sandbag is a not-for-profit (ASBL) organisation registered in Belgium under the number 0707.935.890. EU transparancy register no. 277895137794-73. VAT: BE0707935890