
Supply-demand analysis of the EU ETS reform: Letting Industry Loose
This note aims to put numbers on the amendment proposed by the European Commission to the Directive ruling the European Emissions Trading Scheme (ETS) as part of its Fit-for-55 package, and its impact on the supply and demand balance of emission allowances (EUA).
In July, Sandbag reacted to the proposal with an analysis of the new effective constraint on the ETS created by the amendment, stressing that 1.8 billion EUAs will remain available for European emitters to exceed their cap, allowing industrial installations to actually increase their emissions.
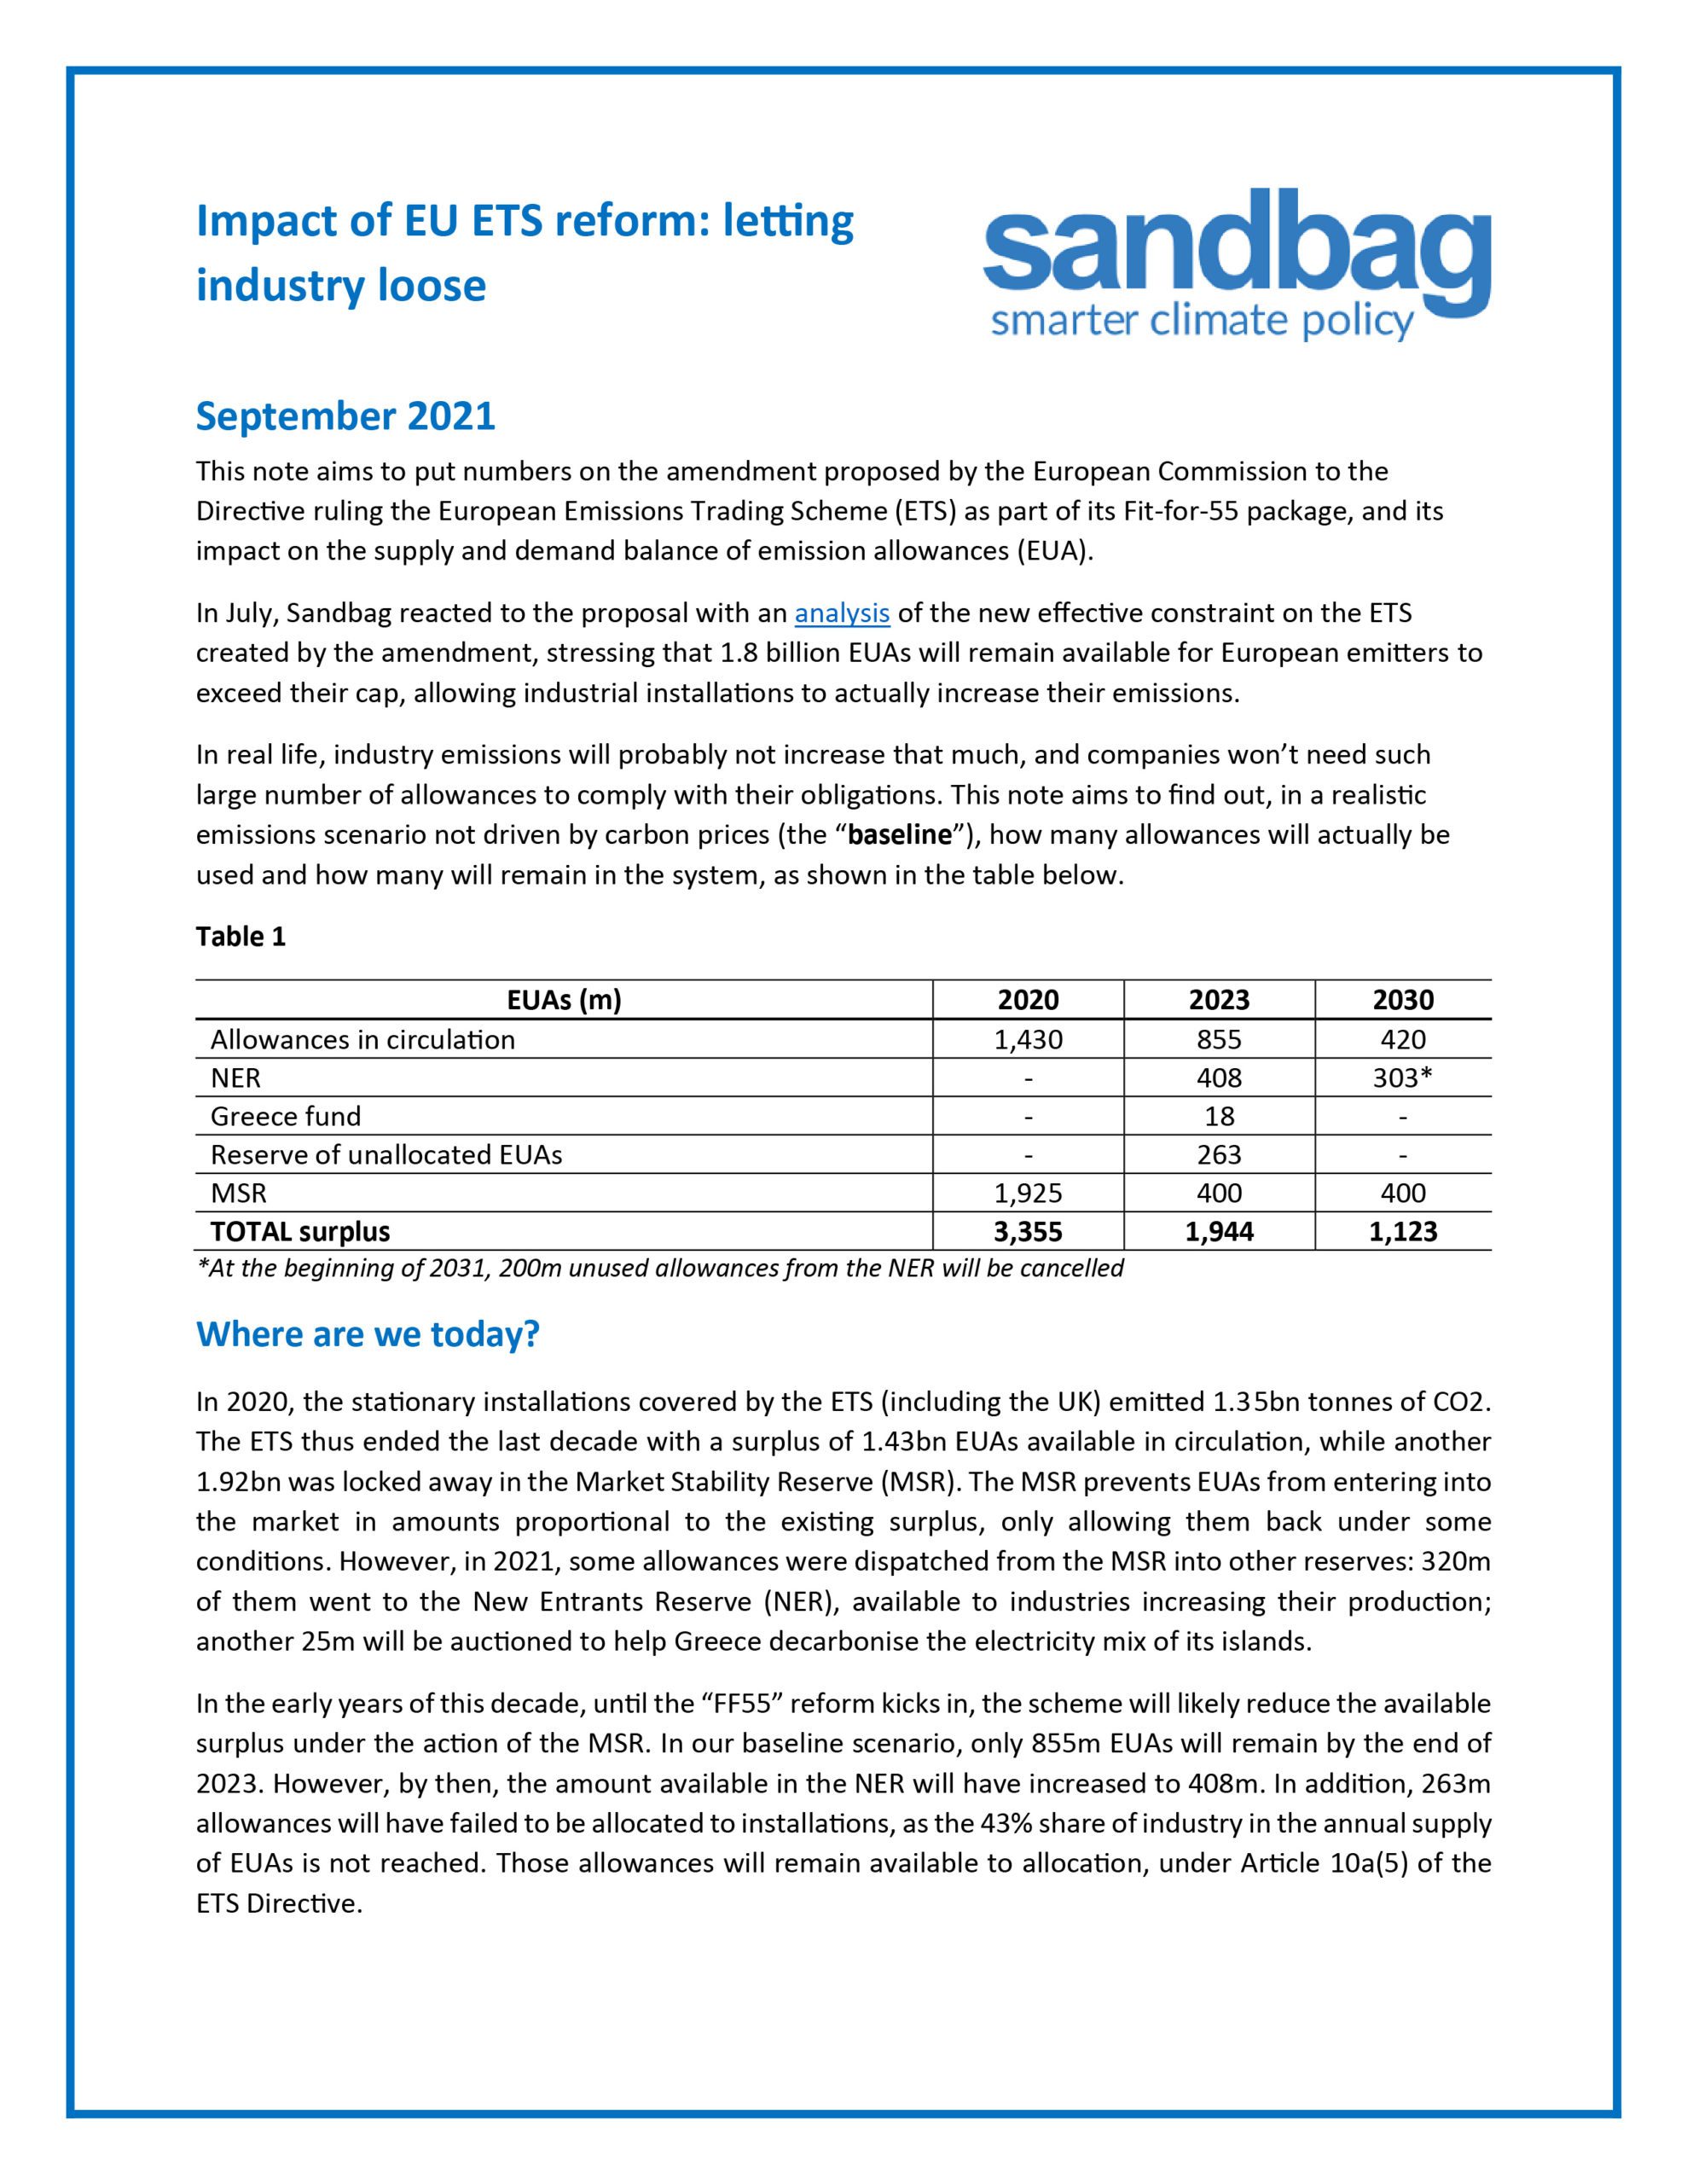
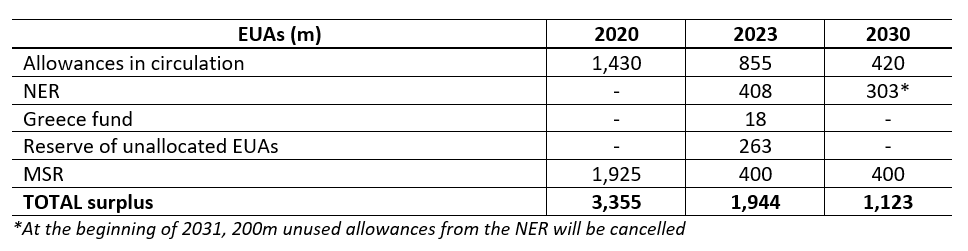
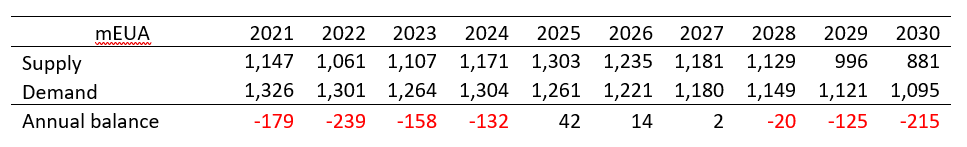
Realistically, industry emissions will probably not increase significantly, and companies won’t need such large numbers of allowances to comply with their obligations. This note aims to find out, in a realistic emissions scenario not driven by carbon prices (the “baseline”), how many allowances will actually be used and how many will remain in the system, as shown in the table below.
Where are we today?
In 2020, the stationary installations covered by the ETS (including the UK) emitted 1.35bn tonnes of CO2. The ETS thus ended the last decade with a surplus of 1.43bn EUAs available in circulation, while another 1.92bn was locked away in the Market Stability Reserve (MSR). The MSR prevents EUAs from entering into the market in amounts proportional to the existing surplus, only allowing them back under some conditions. However, in 2021, some allowances were dispatched from the MSR into other reserves: 320m of them went to the New Entrants Reserve (NER), available to industries increasing their production; another 25m will be auctioned to help Greece decarbonise the electricity mix of its islands.
In the early years of this decade, until the “FF55” reform kicks in, the scheme will likely reduce the available surplus under the action of the MSR. In our baseline scenario, only 855m EUAs will remain by the end of 2023. However, by then, the amount available in the NER will have increased to 408m. In addition, 263m allowances will have failed to be allocated to installations, as the 43% share of the annual cap dedicated to free allocation will not be reached by that year. Those allowances will remain available to allocation in later years, under Article 10a(5) of the ETS Directive.
Post-reform cap: factoring in LRF, rebasing, maritime transport
As noted before, the proposal’s ambition figures for the main ETS are slightly inconsistent: the linear reduction factor of 4,2% if applied from 2021 makes a 62% reduction, according to the EC’s own impact assessment [1], instead of the stated -61%, compared to 2005 levels. In doubt, we have taken the more conservative assumption guided by the 4.2% LRF, which leads to a 62% reduction of the cap. The proposed rebasing is 117m tonnes if applied in 2024. This aligns the new cap with the 2020 cap.
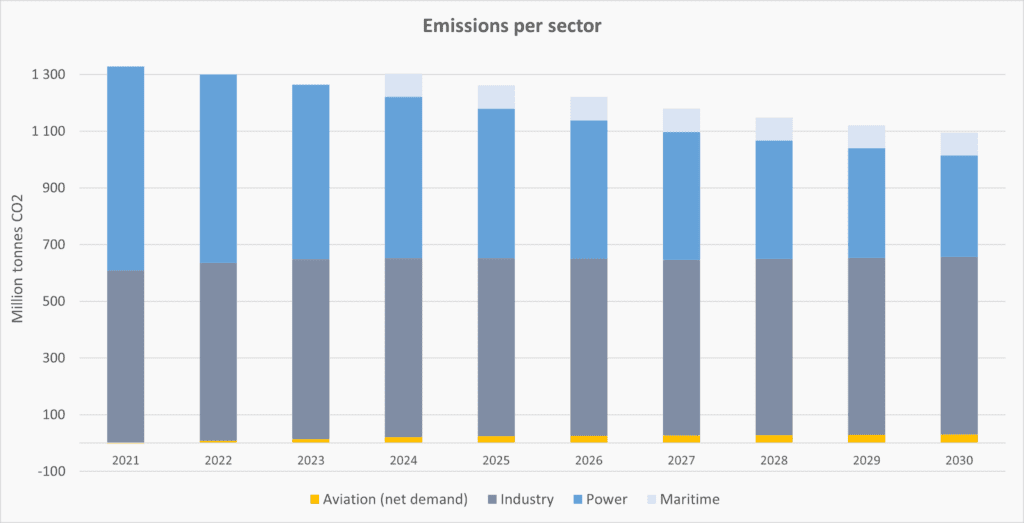
Under our baseline scenario, emissions from the maritime sector follow the European Commission’s `Projected emissions´ as per its impact assessment; aviation emissions follow the growth path corresponding to Eurocontrol’s traffic assumptions until 2025, minus 1% annual emission efficiency improvement; the power sector follows the route dictated by the EC’s MIX scenario, defined as “Medium intensity increase of EE, RES and transport policies versus Reference” [2]. Industrial emissions remain stable over the decade, from 609m tonnes of CO2 in 2021 up to 626m in 2030. More details on scenarios, assumptions and methodology can be found in our ETS Simulator.
Supply: a pile of reserves
The supply is driven by a combination of certain and uncertain factors. On the certain side, 57% of the cap are scheduled to reach the market annually, mostly auctioned (although 3% could be given for free to industry). Other certain sources of supply include 450m to be auctioned gradually for the Innovation Fund, and 25m for the Greece fund.
On the uncertain side, a maximum of 10m annually might be used by non-ETS sectors as part of the Effort Sharing Regulation, and would be deducted from the auctioned volumes. Some Member States might cancel allowances, although no such firm commitments have been made so far. A larger source of uncertainty is that free allocation to industry is based on the production levels of a list of industrial products and processes. If the plants produce more, they receive more allowances, so that they can make profits from reducing their emissions below the free allocation benchmark values. However, if emissions are reduced through the substitution of ETS-covered products/processes by others not covered by the ETS, no allowances are given or even issued. For example, in the steel sector, emission reduction pathways involving a large use of circularity would result in a dramatic fall in the supply of allowances, whereas pathways involving a large use of hydrogen would boost the supply of allowances. Read more on benchmarks here.
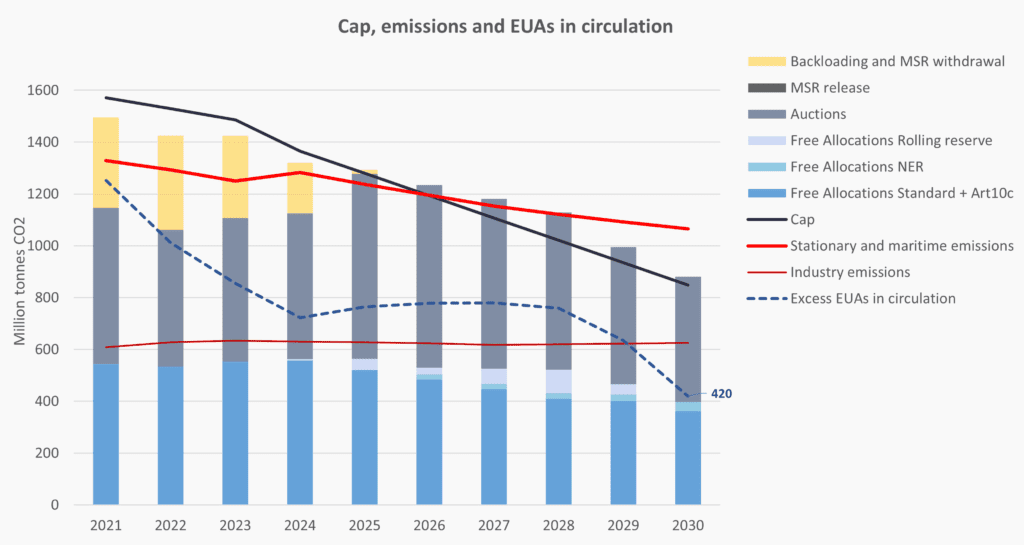
In the chart below, we made the assumption that the EU’s hydrogen strategy, taking low carbon hydrogen production to 10m tonnes by 2030, is met. Production generally follows its historical trend, with a few exceptions such as fertilisers and refining, which are planned to decline as a consequence of various policies.
In this (fairly conservative) baseline scenario, with stagnating industrial emissions, the surplus of allowances decreases by a fair amount until 2030 but remains equivalent to a whole year’s worth of emissions, at 1,123m, of which 420m will be ‘in circulation’ while the rest are locked in the NER (303m) and in the MSR (400m). The below chart illustrates how different ‘layers’ of free allowances are released at different times.
The myth of hedging demand
Extra demand is often said arise from power producers for hedging purposes. Power utilities claim that they needed to secure a supply of EUAs on top of their immediate needs to hedge their future power sales, because they buy EUAs as they sell power for delivery into the next 2-3 years. The argument goes that such extra demand could create a shortage of EUAs resulting in spiralling prices.
However, power utilities only purchase forward EUA contracts for delivery in the future, not spot EUAs, so the underlying EUAs do not actually need to be on the market for those contracts to be purchased or sold. Hedging activity does not alter the current supply and demand balance of underlying allowances.
Forward purchases by utilities only require the existence of (short) sellers on future markets. Hedging needs will fade away rapidly as the power sector decarbonises, which gives certainty that the demand will ease rapidly. That certainty of future falling demand would prevent any spiralling of prices by prompting short selling activity.
We therefore assume that hedging demand does not affect the supply/demand balance and has only a marginal effect on the equilibrium price.
Read Sandbag’s previous work on the ETS revision here.
Price drivers: bears behind the hill
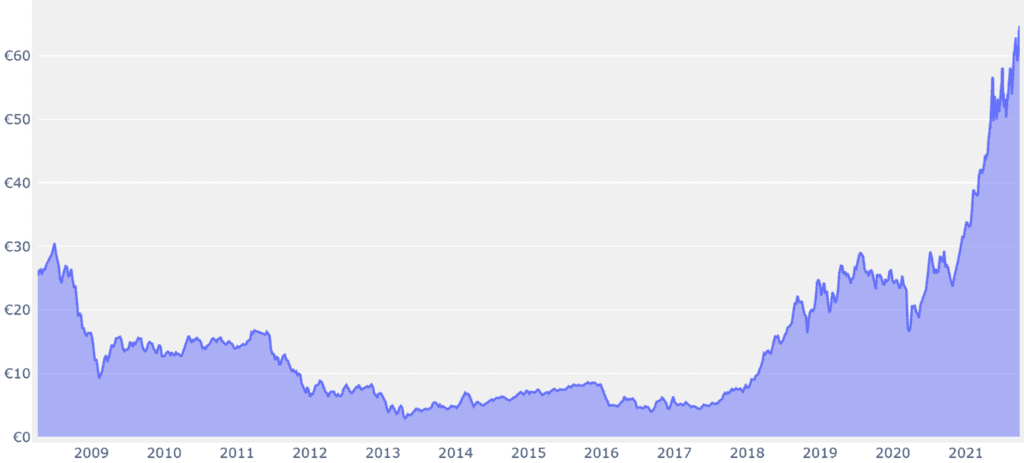
The EUA price is currently at record highs, reaching over €65 on 28 September. This might lead some to say that “the ETS is working”, setting a real constraint on polluters. However, many factors make the current situation very special and probably not reflective of carbon price levels after specific circumstances have passed.
1. Temporary action of the MSR
Since 2014 (except in 2020), the annual supply and demand balance of allowances has been negative, thanks to the action of the MSR. This contributes to reducing the surplus in circulation, by reducing ‘fresh’ supply. However, although there are still plenty of allowances around, they are sitting on private registry accounts and will only reach the market if their owners decide so. For some industries, such decision may be quite strategic and need certainty on the future regulatory framework before being made.
2. Uncertain regulatory regime
The very industries needing regulatory certainty are currently facing the highest uncertainty. Free allocation is hotly debated at the moment in European spheres, and industries are left in the dark between the benchmark reform (scheduled for 2026), the phasing out of free allocation altogether for their particular sector due to the entry into force of a Carbon Border Adjustment Mechanism (considered for steel, aluminium, cement products and fertilisers) or a shortening of the ‘carbon leakage list’ (one option currently discussed for the other sectors). This situation will pass.
3. Abundant liquidity
Industries not selling EUAs are sitting on very valuable assets. The current situation of economic rebound and abundant liquidity in financial markets makes the need to sell those assets less of a priority. It is quite possible that, in more difficult financial times, selling activity might notch up much higher in the priority list. This consequence of free allocation might contribute to making EUAs price hyper-cyclical.
4. Gas prices and low wind
Low wind level in the first half of this year has caused the use of fossil fuel plants beyond expectations, creating extra demand for emission allowances. With very high short-term gas prices, generators might be buying even more allowances in order to use alternative, more polluting fuels such as coal or oil. Such temporary high demand does not impact the market’s overall balance, because the higher demand will only result in smaller available surplus this year, compensated by fewer withdrawals into the MSR in the next few years. If anything, it rather has a bearish effect on the future balance, while luring more industrials to sell their accumulated surplus in the short run, due to the higher EUA prices.
5. Long buying
Financial investors are currently taking long positions on EUAs, expecting prices to rise further. This is despite the existence of a short-term annual supply squeeze doubled with long-term surplus in the ETS, which would normally make short-selling the dominant posture. Those investors contribute to rising prices but this phenomenon, also, could reverse quite quickly.
Notes
[1] In the EC’s Impact Assessment, a linear factor reduction of 4,22% makes a -62% reduction for the current ETS scope, with a rebasing in 2024 (Scenario AMb2c, table 5, p.65). Under the same scenario, the extension of the ETS to the maritime sector reduces the LRF by 0,02% points (p.146), leading to a LRF of 4,20%, which is the value currently proposed for a -61% reduction.
[2] See Table 35 in the EC’s Impact Assessment, p. 330.
Photo by Christopher Burns on Unsplash