Industry emissions experience biggest annual drop towards end of Phase III
Disclaimer: Analysis done on the basis of number available on EUTL on April 1st COB 2020, some verified numbers still due to be coming in by May 2020
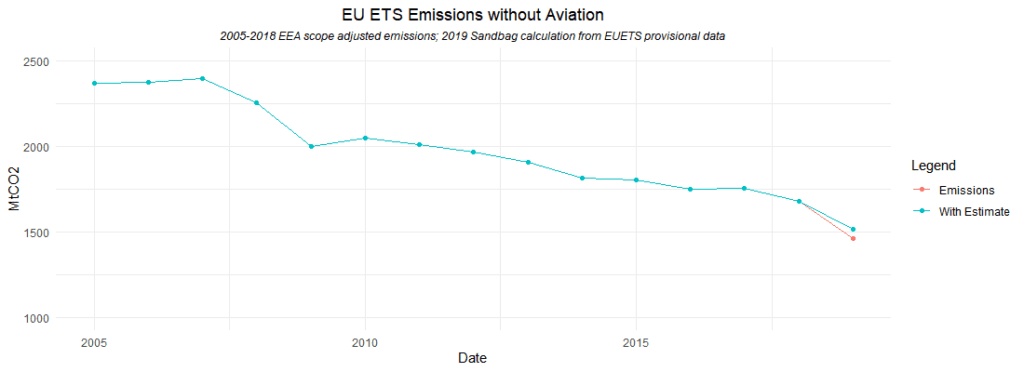
Reported 2019 emissions were 1523 MT CO2 (1464 MT excluding aviation vs. 1686 MT in 2018). This is not the final number as information on Bulgaria and Luxembourg as well as some aviation companies’ emissions is not yet published. Based on a like-for-like comparison (applying reported sector variations to e.g. those countries and aviation on the basis of their 2018 emissions) we estimate the final emissions will be at 1518 MT without aviation and 1588 MT total, making it a 10% fall in emissions.
 Eliot Tabet EU ETS Analyst:
“It is shocking to see how much emissions had already fallen in 2019 so with the current coronavirus situation, we are looking at ending Phase III with emissions being at -20% below the cap, possibly even lower – this requires urgent action on the cap before the start of Phase IV” Contact address: eliot@sandbag.be
2019 was the year when the carbon price was at its highest in Phase III and most stable at a relevant level at (approx. 25 €/Ton). Average price has not leveled off since the good performance of 2018, despite demand having fallen by 9% from 2018. Reported aviation emissions were approximately 13% lower than last year and industry emissions were 7% lower, but this is based on only e.g. 70% of the aviation data (326 airlines). On a like-for-like basis, aviation emissions were up 4.3% while industry was still down 3%. We will update the corresponding chart as the data becomes available.
This is huge seeing that industry emissions were flat throughout most of phase III. In effect, this is the largest single drop in one year throughout the whole Phase. This is a good indication that as we approach the end of Phase III and free allocation is running out with cross-sectoral correction factor kicking in, the carbon price is indeed making an impact on industry emissions.
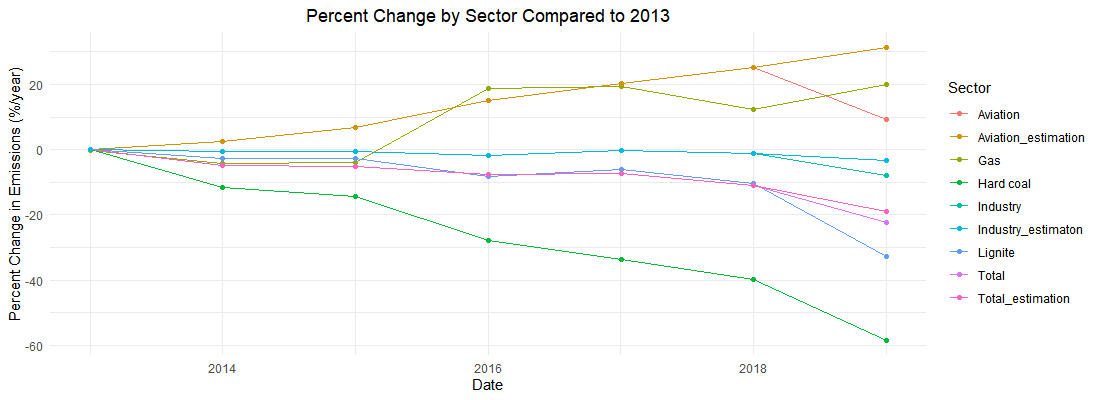
Coal-fired power emissions went down by a bit under 28%, further confirming the 2018-noticed trend of switching from coal to renewables across the EU. An even bigger impact last year likely came from the CO2 winter price hike, which led to an even lower share of coal in the power mix. We see a clear impact of this in the switch in the EU’s power and heat sector directly from highly carbon intensive sources (coal) to carbon neutral choices (renewables) on overall EU emissions. In this context, the 2018-to-2019 rise of 7% in natural gas-fired power/heat emissions could also be due to lower CO2 cost relative to coal, and in 2020 it could go further, if natural gas prices stay low.
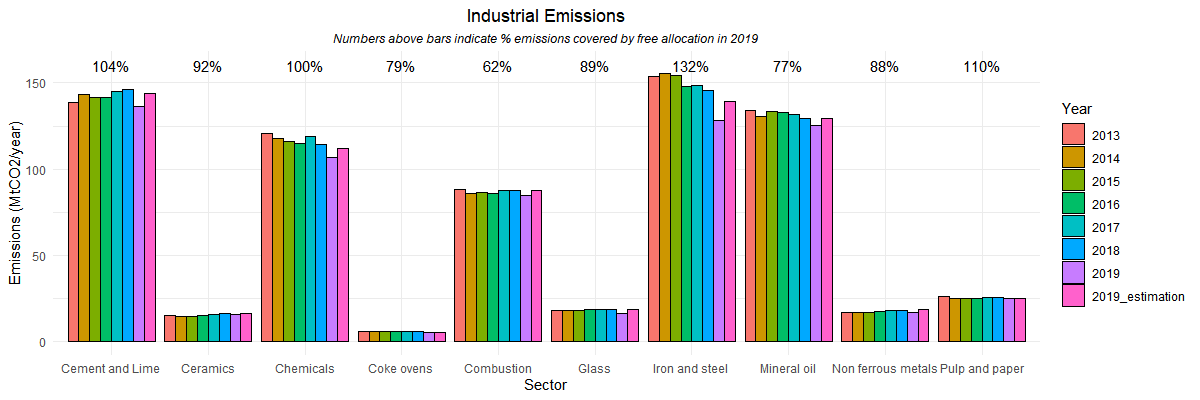
Industrial emissions: A whopping 7% fall (-3% like-for-like)
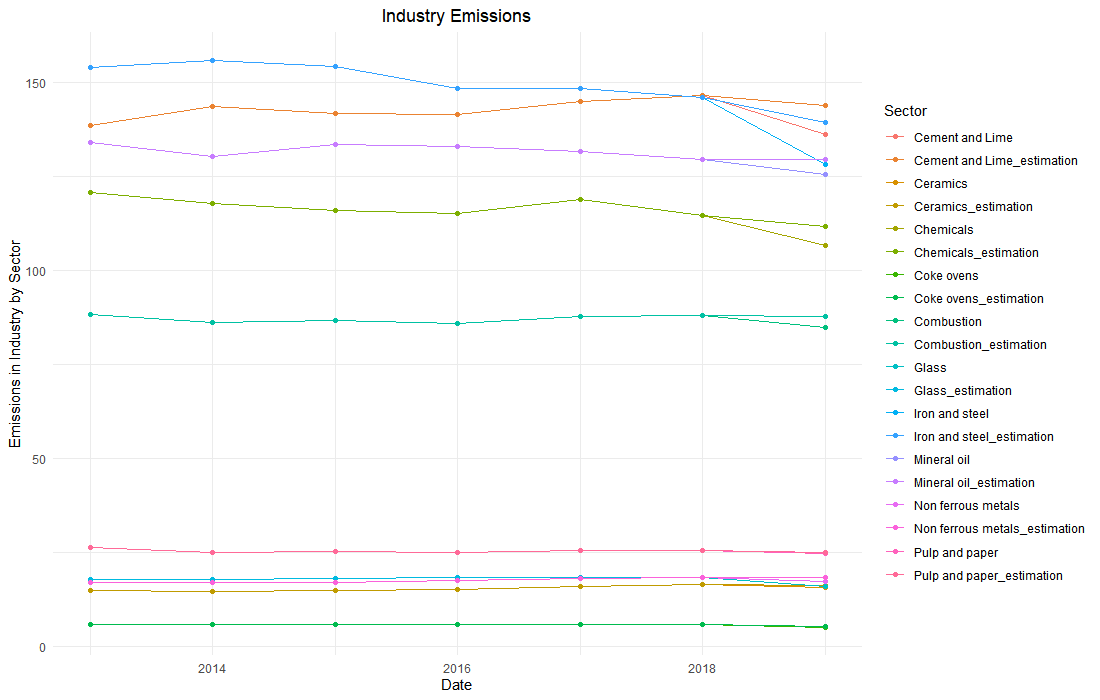
The drop is primarily due to the reduction in emissions from the Iron and Steel (12% fall year on year, -5% like-for-like), Coke Ovens (-8% like-for-like) , Cement and Lime (7% fall, -4% like-for-like) and Chemicals Industries (7% drop, -4% like-for-like) while other industry emissions had smaller variations. As we approach the end of Phase III and industrials are running out of Free Allocation the carbon price is incentivising a more efficient approach to emitting carbon.
 Suzana Carp, EU Engagement Lead:
“The drop in EU industry emissions is the single most important story of the 2019 data release, with the biggest drops being in steel, glass and cement. This makes the EU Industry Strategy land in fertile terrain. The drop speaks of the importance of carbon pricing and reduced free allocation as an effective set of incentives in a portfolio to support net zero industry” Contact address: suzana@sandbag.be
The EU’s top ten emitters – Welcome to Poland’s Kozienice power plant
Top 9 of the 10 biggest polluters seem to be mostly unchanged since last year, welcoming Kozienice in from Number 11 in 2018. Of course, since we do not have extensive data on Bulgaria yet we cannot exclude the high probability that the Maritza power plant will be among them.
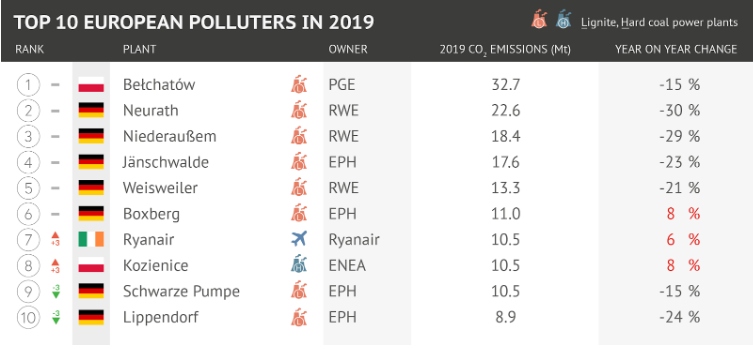
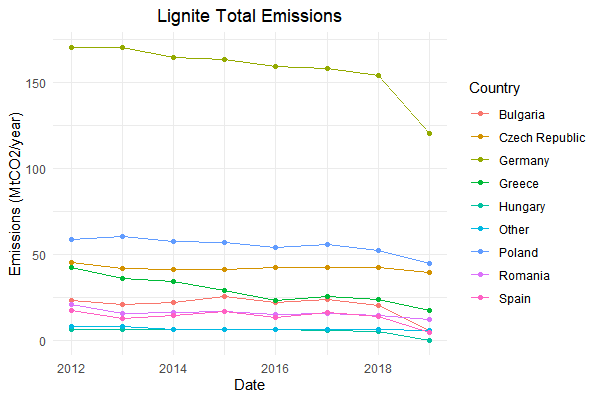
Eight out of ten of the top ten CO2 emitters are lignite power plants. Seven of these are in Germany – the biggest of which, Neurath, saw its emissions fall by 30%. On average these plants’ emissions fell by 13.5% compared to last year’s numbers.
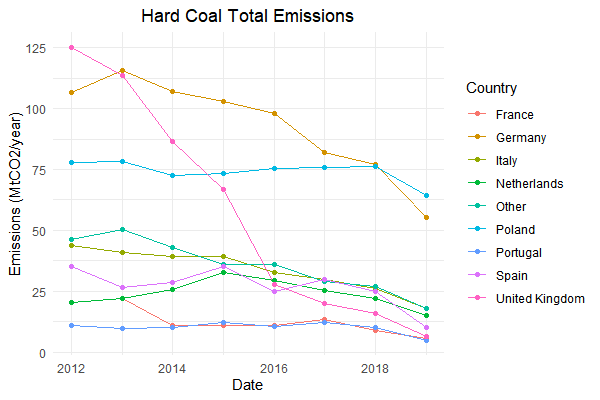
ETS covered coal power emissions continued their freefall
Hard coal power emissions fell by 30% in 2019. The UK almost halved its last year emissions as it reduced them by 6.5 million tons, which is 41% of its last year emissions. Germany reduced its hard coal emissions by 22 million tons (-28%) and Poland reduced its power sector’s emissions by 12 million tons of CO2 (-16%). This is an impressive drop from Poland since at this time last year the country was one of the few not developing plans to phase-out hard coal.
Lignite power emissions dropped by 25% in 2019. Most of this drop can be attributed to Germany, the dominant emitter, where emissions fell by 33.5 million tons (or 22%) since last year.