
Where are we headed?
This week, following the EU Parliament’s vote on February 15th, the EU Council will in turn confirm its preferences on reform of the EU Emissions Trading System. With so many issues to think about – LRFs, benchmarks, MSR withdrawal rates, auction shares, various funds taken from various shares and sources, emissions intensity and trade intensity thresholds, CLEFs, CSCFs, IISs and BAMs and rebasing and so on – the ETS Reform has proved, to borrow a phrase, about as straightforward as a sack-load of kaleidoscopes[1]. Yet the system’s persistent flaw is clear for all to see – the trading cap is too high and the on-going supply of emissions allowances is too fast.
Few stakeholders deny this central policy instrument for achieving climate and energy goals is failing to fulfil its purpose. It is not stimulating cost-efficient emissions reductions through a steady, predictably rising and meaningful carbon price[2]. It desperately needs reform to balance market supply to current and anticipated demand levels[3].
 The debate in the EU Council happens as global sea ice continues to see all time record lows.
Image with thanks to John Cobb
Parliament’s amendments to the original Commission Reform Proposal have resulted in some progress towards tightening supply. This progress is welcomed but it falls far short of what is required [4] and much has been lost in the negotiations for these small gains. The reform process has been seized upon by industrial stakeholders as an opportunity to ‘reverse’ the steady tightening in their free allocation for the 2013-2020 period even though free allocation is only supposed to be a temporary derogation from full auctioning. The only justification is protection of EU industry from activity displacement to regions without equivalent carbon cost. As more regions adopt carbon pricing, carbon leakage risk is decreasing not increasing.
If the Council does not step in to negotiate further tightening of supply, the cost for a tonne of emissions will not rise significantly any time soon[5]. Nor will the number of tonnes big emitters need to buy increase if Parliament’s amendments are left unchecked. The Parliament vote paves the way to higher free allocation for many highly emitting industry sectors.
The pie is still too big and highly emitting sectors have grabbed a bigger slice
Chart 1 below illustrates how some of the most highly emitting sectors will receive more free allowances under the Parliament’s vote.
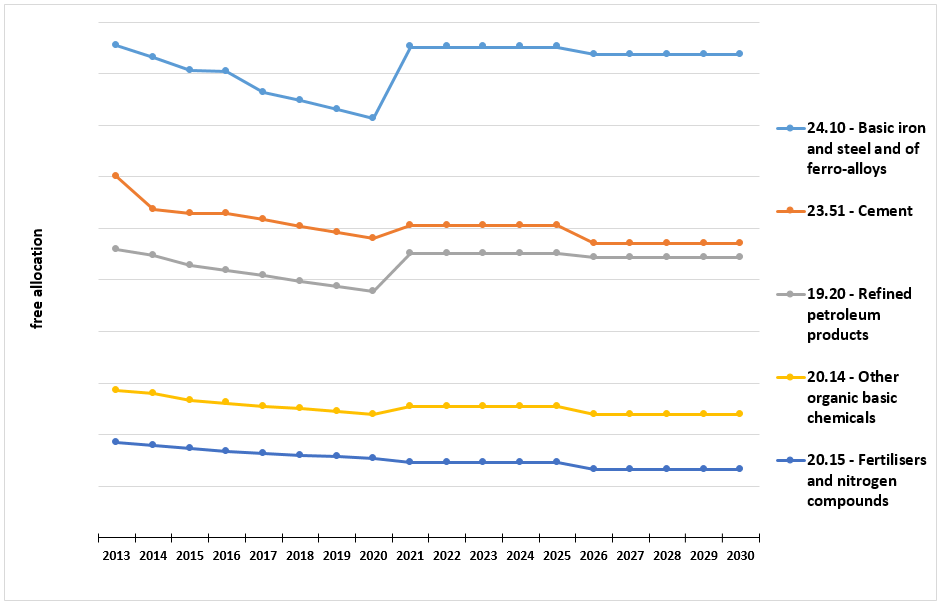 Chart 1. Trend in free allocation for the top 5 emitting NACE sectors; 2013-2020 from EUTL; post-2020 from Sandbag modelling (LRF2.2% continued from 2020cap; NER from Ph4; 300 million innovation support from FA (rest from auctioning); binary CL at 100% & 0% but with 30% FA for district heating; 0% activity growth; 3% of cap set aside for indirect cost compensation (1/3 from FA, 2/3 from auction); BM red -0.3% for Iron and steel & refined petroleum, -1.5% for Paper and paperboard & Fertilisers, -1% rest; auction share red to 54% to avoid a CSCF)
Instead of keeping up the pressure on these areas of high impact, abatement effort will be distributed across a larger number of lower emissions intensity installations. Carbon cost will be transferred to industries left with a hard stop to their free allocation[6].
All sectors are equal but some are more equal than others [7]
Parliament voted to divert up to 5 percentage points from the auction share of the cap (~775 million tonnes) to keep free allocation to industrial emitters still eligible for carbon leakage risk protection at 100% of their benchmarks for as long as possible[8]. Some sectors, such as iron and steel and refined petroleum, are even set to be exempted from any cross-sectoral correction factor (CSCF)[9]. This leaves annual benchmark reductions[10] as the only steady decrease in their free allocation. For these sectors, it doesn’t even matter whether the auction share is reduced or not. They will still receive 100% of their benchmark across the whole phase.
The continuing cement problem
An opportunity to avoid a CSCF by freeing up approximately 20% of the total available free allocation via introducing an Import Inclusion System[11] to address carbon leakage risk for high emissions intensity low trade intensity sectors, such as cement and lime and plaster, was voted down by the Parliament. Even the lead committee Rapporteur voted against this approach despite having brought it into the committee’s compromise position. This decision is particularly questionable given the huge surplus already amassed by the cement sector and the on-going trend expected (illustrated in Chart 2 below)[12]. Considering the oft repeated aim in Council texts of avoiding windfall profits, surely Council cannot allow this opportunity to remove over allocation to this sector to be missed?
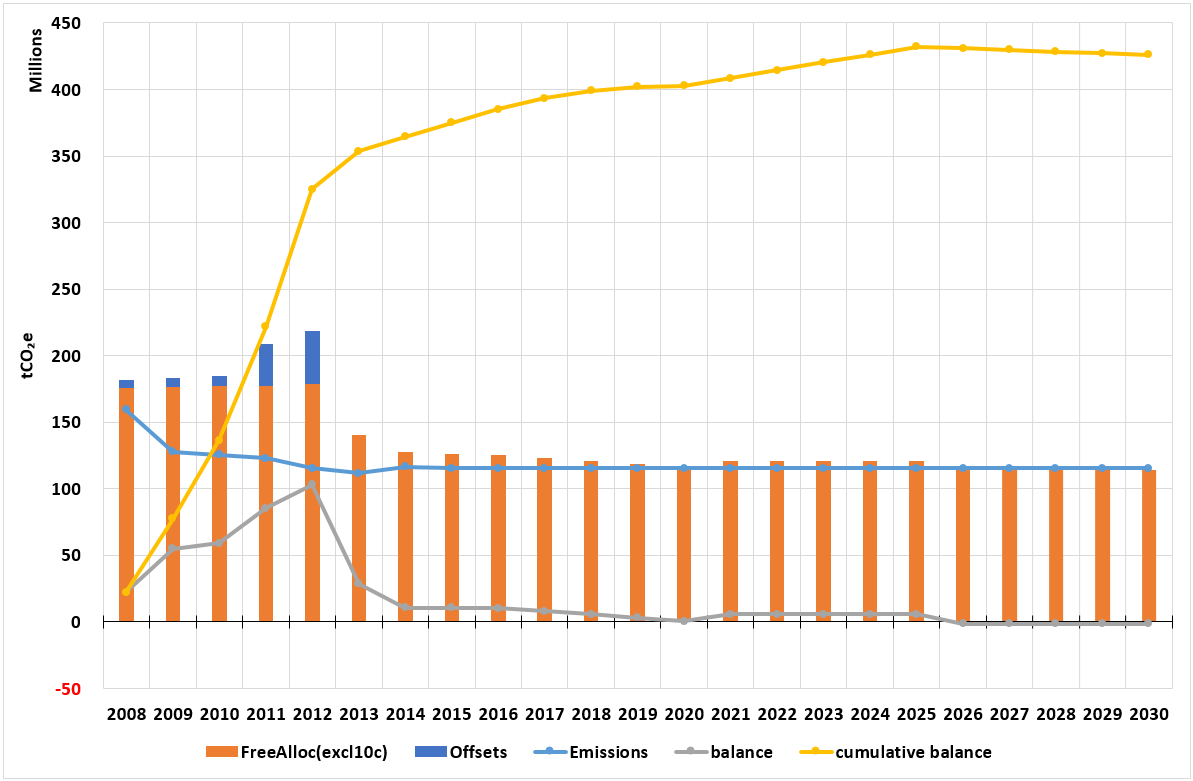 Chart 2. Trend in allowance supply balance[13] for NACE sector 23.51 Cement; 2008 to 2020 data from EUTL (with emissions held at 2015 levels); post-2020 from Sandbag modelling (LRF2.2% continued from 2020cap; NER from Ph4; 300 million innovation support from FA (rest from auctioning); binary CL at 100% & 0% but with 30% FA for district heating; 0% activity growth; 3% of cap set aside for indirect cost compensation (1/3 from FA, 2/3 from auction); BM red -0.3% for Iron and steel & refined petroleum, -1.5% for Paper and paperboard & Fertilisers, -1% rest; auction share red to 54% to avoid a CSCF)
Which countries gain most from Parliament’s position on free allocation?
It becomes easier to understand why different countries might have different attitudes towards loss of their auction allowances when you see how the highly emitting industries are distributed across the countries and compare average Ph4 free allocations to 2020, as illustrated in Charts 3 & 4 below.
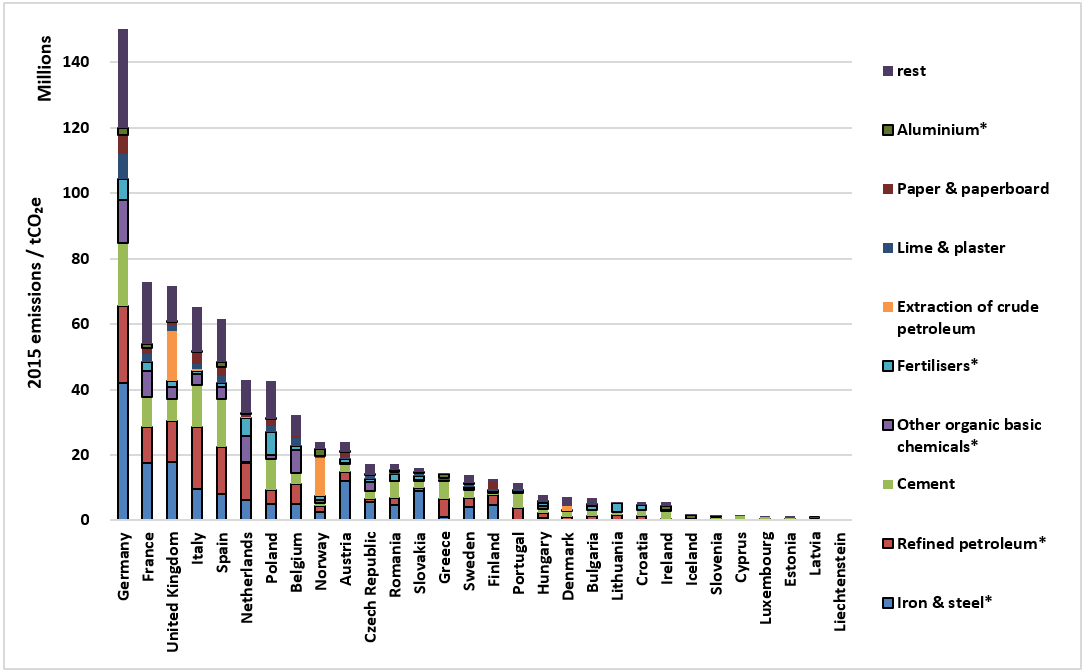 Chart 3. Split of the top emitting industrial sectors across Member States; sectors proposed to be exempted from any CSCF are outlined and marked with an *; emissions data from EUTL; mapping of installations to NACE codes as provided by the Commission for 2015-2019 carbon leakage list complemented by in-house desk research
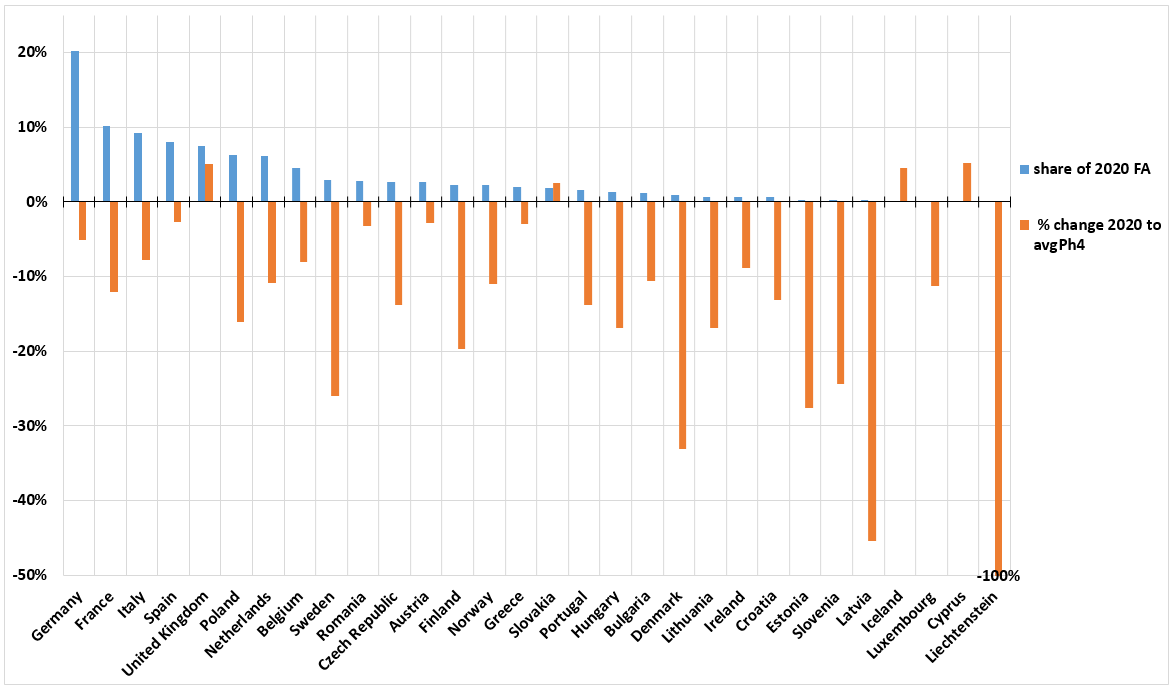 Chart 4. Comparing how Member States share of the industrial free allocation will change from 2020 to avg across Ph4; 2020 data from EUTL; post-2020 from Sandbag modelling (same assumptions as Charts 1 & 2)
All is not yet completely lost ….
Council can still insist on:
- Doing more to tighten supply
- Extending the period of doubling the MSR withdrawal rate
- Capping the size of the MSR or limiting the validity of allowances held in the reserve (i.e. by supporting the Feb 24 joint proposal from France, Luxembourg, the Netherlands & Sweden[14])
- Supporting proposals for voluntary Member State cancellations
- Ensuring all unallocated Ph3 allowances are safely diverted into the MSR and do not augment the Ph4 cap
- Ensuring no allowances are released from the MSR until the release threshold is reached
- Ensuring that participants who have invested to reduce emissions intensity from the 2007-2008 data benchmarks gain cost advantage over their peers who haven’t
- Maintaining -0.5% minimum and -1.5% maximum flat rate benchmark reductions (rather than -0.25% & -1.75% based on new benchmarking calculated before the start of each half of the phase)
- Not relaxing current carbon price signals for industry sectors
- Keeping the auction share at 57% (i.e. rejecting the Duncan mechanism)
- Not exempting certain sectors from any CSCF
- Rejecting the Parliament’s amendment to include the full carbon content of waste gases. This amendment was squeezed in with little time for full public scrutiny despite a recent Court of Justice judgement[15] which confirmed the methodology applied by the Commission when establishing the benchmarks for free allocation of allowances for the period 2013 to 2020.
- Keeping the door open to the introduction of an Import Inclusion System for lower trade intensity sectors
- An IIS (or Border Adjustment Measure) would delay the need for a CSCF without decreasing the auction share. It would also drive up demand for auctioned allowances thus bolstering prices and increasing Member States’ and funds’ revenues.
… we certainly need stronger political will if we are to drive down industrial emissions – rebasing, anyone?
References
[1] Terry Pratchett (Raising Steam)
[2] Prices remain stubbornly low at around €5/t and are expected to stay at these levels without serious supply reform; see Sandbag presentation ‘Assessing the ENVI Report’ (slide 11) available here
[3] Sandbag estimates that the surplus will exceed 3 billion by the end of the current phase (including backloaded auction allowances and allowances as yet unallocated).
[4] Parliament has voted to double the withdrawal rate of allowances from the market into the Market Stability Reserve (MSR) for 3 years and to cancel 800 million allowances destined for this reserve. Sandbag estimates that this translates to just 100 million fewer allowances available to market by 2030 – a small dent compared to the overall surplus expectation of 3.2 billion (which includes the allowances n the MSR).
[5] See Sandbag presentation ‘Assessing the ENVI Report’ (slide 11) available here
[6] Their free allocation would have gradually phased out under the existing Directive and would have been fixed at 30% of benchmark under the Commission’s original reform proposal.
[7] Borrowing another phrase …. George Orwell (Animal Farm)
[8] An approach referred to as the Duncan mechanism, after the lead committee Rapporteur MEP Ian Duncan
[9] The current Directive and the Commission Proposal allow for a uniform CSCF to be applied to the benchmarked free allocation applications of all sectors in the event of the total application for free allocations exceeding the maximum available.
[10] The Commission proposed to reduce benchmarks by at least 0.5% per annum 15x for 2021-2025 allocations (2008 to the middle of the 1st half) and 20x for 2026-2030 allocations (2008 to the middle of the 2nd half). Parliament has voted for a minimum reduction of just 0.25%. Parliament even voted to raise the benchmark for the iron and steel sector to take full account of the carbon content of waste gases despite the use of such gases to generate electricity.
[11] Importers without carbon cost in their own regions would have been required to face the same carbon cost as EU manufacturers.
[12] Sandbag has released several reports and briefings highlighting problems with free allocation to cement; see here, here & here
[13] balance = free allocation + offsets – emissions
[14] 6675/17 ADD 1 available here
[15] ECLI:EU:C:2016:647, 8 September 2016, available here