
The EU ETS Phase II (2008-2012) was badly affected by an economic crisis of historical proportions which saw a massive drop in demand for allowances on the carbon market. This put a shock in the ETS system and the carbon price dropped from 30 EUR/t in 2008 to the familiar 5 EUR/t by 2013 where it hovered for several years. We recently managed to get the persistently irrelevant price fixed in the previous ETS revision and we are seeing it faring well in the current economic downturn.
Yet, many analysts expect the novel coronavirus pandemic to have a comparable impact or worse than the 2008/09 crisis on the EU economy – therefore, in this briefing, we seek to present its estimated effect on the Phase III surplus. More specifically, depending on the extent (length and recurrence) of lockdowns across EU Member States, and the inherent economic halt, we provide alternative scenarios for total emissions in 2020. Since the EU ETS surplus from the current Phase will be carried over into the next one, this is critical in understanding the robustness of the EU ETS at the beginning of its longest Phase yet, Phase IV (2021-2030).
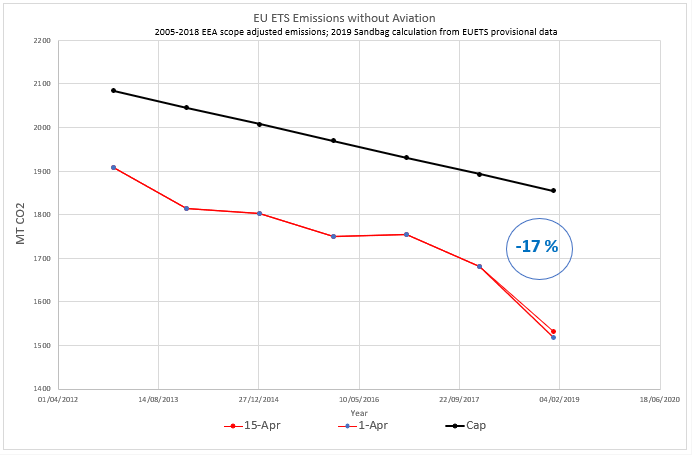
On April 15th most of the data for the power and industry sectors in the EU (ETS emissions) in 2019 was made public. We compared these to our estimates on the premise of the April 1st data to notice that the total without aviation emissions we had foreseen in our estimated emissions was 1518 MT whereas real emissions were 1532 MT, i.e. 17% less than the cap for 2019 (1854.7 MT).
In order to forecast where emissions may be by the end of Phase 3 (end of 2020), we carried out our estimates for 2020 using 2019 emissions as reference. We created 2 scenarios:
- Scenario 1: lockdown lifted across EU Member States by May 15th, 2020
- Scenario 2: lockdown lifted across EU Member States by May 15th 2020, but a second wave hits Europe September 15th, 2020 and lockdown is reinstated as of that date until the end of the year
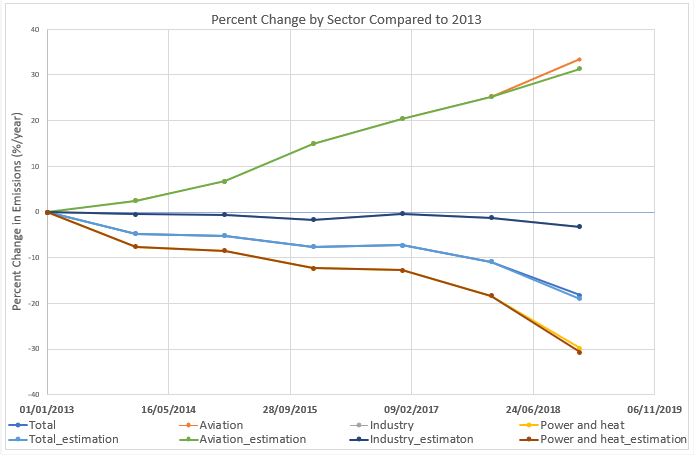
Before we start into the surplus analysis, let us see in more detail where 2019 ended. Our industry emission estimate was accurate by 99.80 % (0.92 MT difference) and our aviation sector estimates were accurate by 98.5 % (1 MT difference). The rest, the 14 MT difference, comes from the power and heat sector where we were 98.6% accurate. The chart below illustrates the difference in percentage terms since 2013.
We apply our analysis on the most up to date indication of real emissions in the EU ETS which is presented above. Since then, the pandemic-prompted lockdown regime has led to the partial or total shutdown of many energy-consuming activities, with a visible effect on energy demand across the EU. This demand drop inherently caused a decrease in power and heat generation, which in turn means lower CO2 emissions.
Consequently, we defined a straightforward model to estimate total energy-related emissions in 2020, using 2019 as the reference year.
Our assumptions per sector:
- Industry: monthly emissions reduction of 30% due to partial or total shutdowns caused by the lockdown. Recovery expected gradually within 6 months after the lockdown ends. Historically, this has been the observed catchup lag between financial markets and national economies – as happened during the 2009 H1N1 pandemic 1;
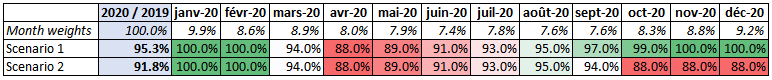
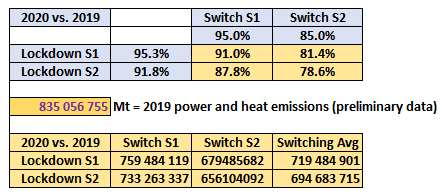
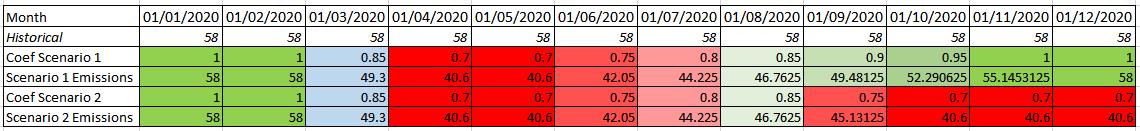
- Power and heat generation: monthly emissions reduction of 12%, factored in with a non-lockdown-related 10% decrease due to switching away from coal. Relative to 2019 monthly references, this means 88%*90%=79.2%, so an overall 21.8% drop. Recovery (from the lockdown decrease only) also expected gradually over 6 months, in tune with the economy;
- Aviation: we based our scenarios on the ones published by Eurocontrol on 27 April 2020 2.
Both of these scenarios have been included in the graph below:
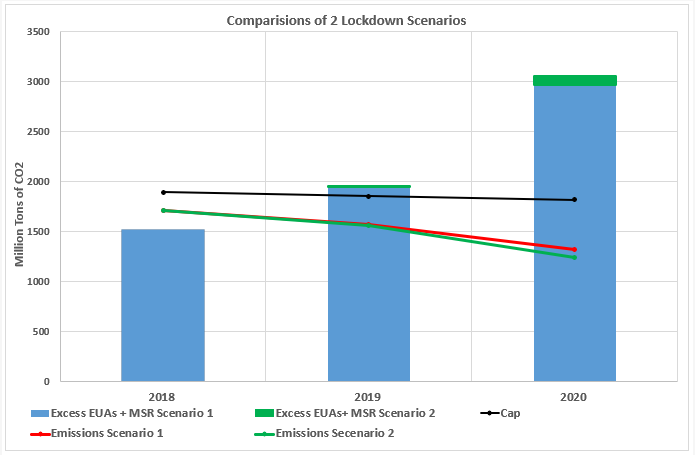
According to our model, by the end of Phase III, emissions, not considering the aviation sector, will be at 1315 MT (- 27%) and 1242 MT (- 31%) below the ETS cap in scenarios 1 and 2, respectively. In both scenarios, the surplus exceeds 2900 MT, the equivalent of almost 2 years of emissions (at 2019 levels) would be carried into Phase IV, only part of which will be captured by the Market Stability Reserve (MSR).
However, the residual excess EUAs not captured by the MSR will start rising in 2020. As illustrated by the chart below, in scenario 1, 1253 MT of excess EUAs are present in 2019 and 1343 MT in 2020. Scenario 2, calculates an even steeper increase of excess EUAs, to 1428 MT in 2020.

Eliot Tabet EU ETS Analyst:
“Despite withdrawals into the Market Stability Reserve, the residual surplus of EUAs will rise again this year in all scenarios, to at least a year’s worth of emissions. Even with a 24% withdrawal rate, the MSR won’t keep up with the rising surplus” Contact address: eliot@sandbag.be
To reduce the ballooning surplus of EUAs, the EU has implemented two mechanisms to withhold the sale of allowances: ‘backloading’ in 2014-2016 and the Market Stability Reserve from 2019, into which some excess EUAs are taken. EUAs can also be purchased by airlines since 2013 for compliance with a separate aviation market, which reduces the supply further. Despite all these measures, the residual surplus (dark blue line) will exceed annual emissions this year.
Lockdown scenarios
Power and heat generation
Lockdown scenarios
NB: We assumed the current context has the same effect on heating production as it does on power generation, as accurate data for heating is scarcely available with daily precision, and much of the heat produced comes from coal/gas-fired plants producing both forms of energy.
Coal switching scenarios
The lockdown effects notwithstanding, we assumed that the trend observed in recent years in heat and power generation, of coal being replaced by non-emitting sources (wind/solar PV), or in some cases, lower emission sources (natural gas), would continue in 2020. Deciding on a switch % factor depends on various factors – demand evolution, fuel costs, renewable projects delays, EUA prices, maintenance (re)scheduling etc. – therefore, we assumed that this factor would be of minimum -5% and maximum -15% in “power and heat” emissions and chose the average, of -10%, for our calculations.
Based on the above, combined calculations yield the following results for power and heat emissions:
The Market Stability Reserve review in 2021 has to look at the appropriateness of the current thresholds to cope with the giant historical surplus the ETS will inherit for Phase IV.
Industry Sector
- Scenario 1 emissions: 594 454 687 MT CO2
- Scenario 2 emissions: 546 468 750 MT CO2
Aviation Sector
- Scenario 1 emissions: 39 832 448 MT CO2
- Scenario 2 emissions: 27 557 956 MT CO2

 Suzana Carp EU Engagement Lead:
“There was already a pressing need to adjust the EU ETS cap to real emission levels and to the Paris Agreement before the pandemic began. Following the lockdown, this becomes an urgent necessity, without which Phase IV is doomed to be shadowed by an immense oversupply of 2 years worth of 2019 emissions equivalent” Contact address: suzana@sandbag.be
References
- https://www.entrepreneur.com/slideshow/348392
- https://www.eurocontrol.int/sites/default/files/2020-04/eurocontrol-aviation-recovery-factsheet-27042020.pdf
- https://ec.europa.eu/clima/sites/clima/files/ets/reform/docs/c_2019_3288_en.pdf
- https://ec.europa.eu/clima/ets/ice.do?search=search&accountFullTypeCode=1&form=ice®istryCode=-1&exportType=1&exportType=1¤tSortSettings=&iceInstallationId=&languageCode=en&exportAction=ice&exportAction=ice