
Our data tools
Our in-house tools provide the insights needed to develop evidence-based and data-driven climate policies
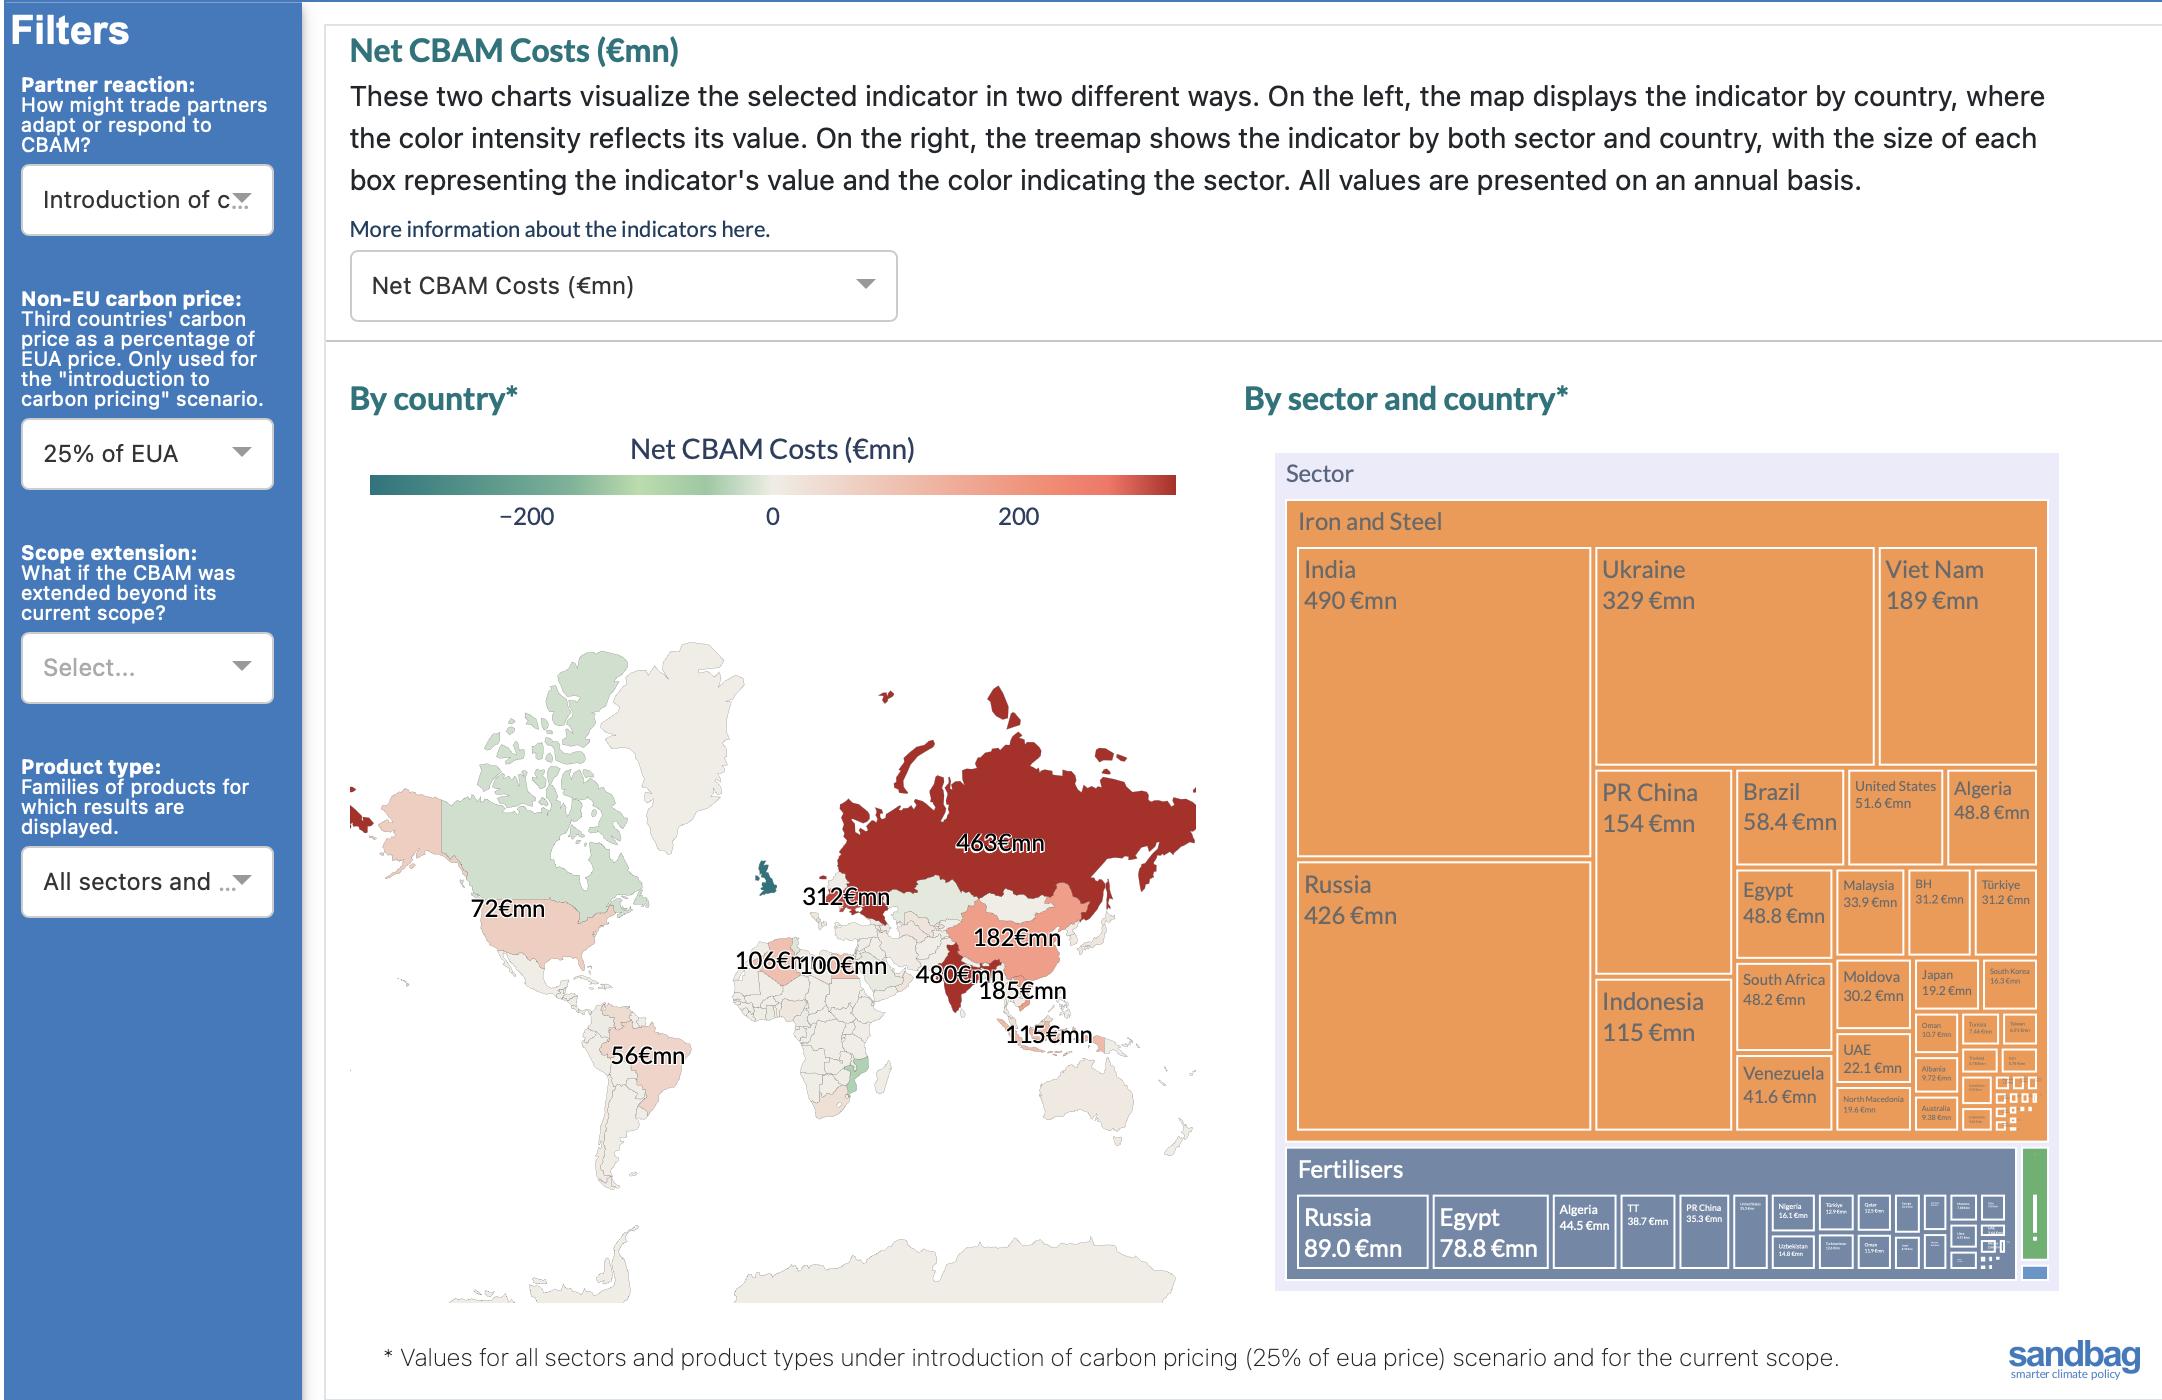
CBAM Simulator
Explore how CBAM affects countries and sectors under different assumptions. Compare scenarios, see net costs, and export results
-
Country and sector insights: See how CBAM fees and revenues vary by country and sector, based on transparent and adjustable assumptions.
-
Scenario comparison: Explore different carbon price levels, pass-through rates, and phase-out timelines to understand net CBAM costs and opportunities.
-
Exportable results: Download and share your data visualisations to support analysis and policy discussions.
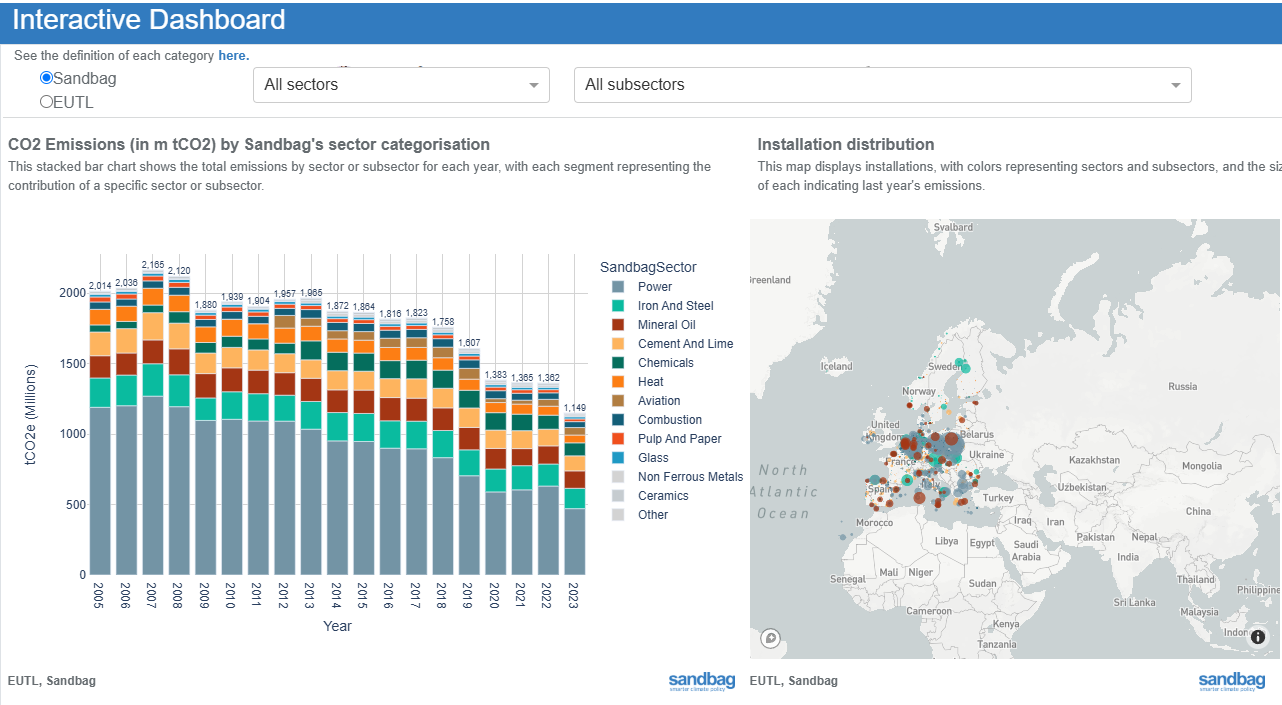
EU ETS Dashboard
Navigate EU ETS emissions data at various granularity levels
- Sector emissions: Understand how each sector and subsector contributes to emissions under the EU ETS, comparing different sector allocations.
- Installation eistribution: Visualise the locations of individual installations across Europe and see the biggest polluters and their previous year’s emissions. Installations can be filtered by sector or subsector, being able to see BF-BOF installations, for example.
- Emissions and allowances: Compare the evolution of emissions and free allowances by sector or subsector over time.
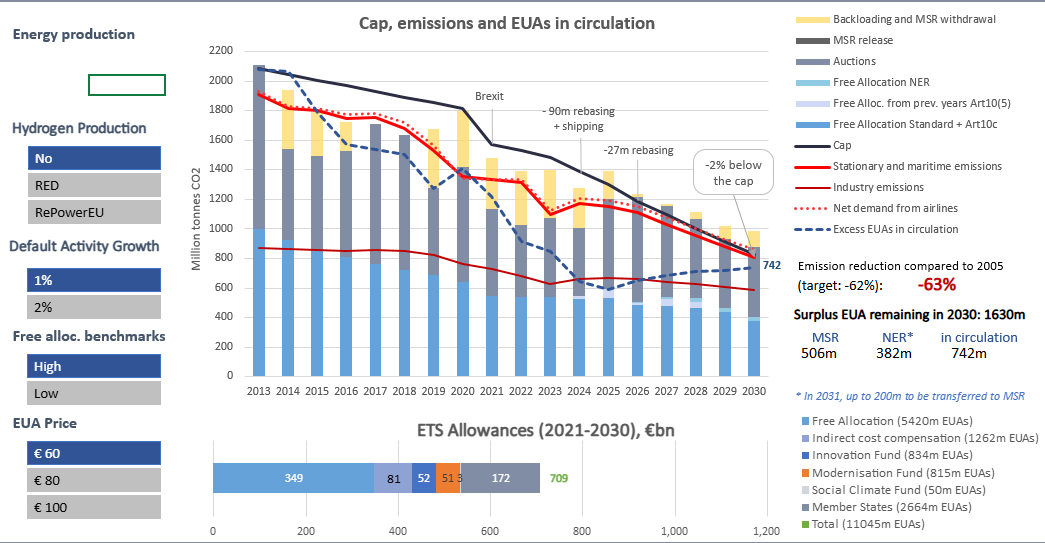
EU ETS Simulator
Analyse the impact of changing parameters on the EU ETS
- Scenario simulation: Adjust variables such as energy production, hydrogen production, free allocation benchmarks, activity growth, and European Emission Allowances (EUAs) prices.
- Supply and demand analysis: See how different scenarios affect the supply and demand of EUAs.
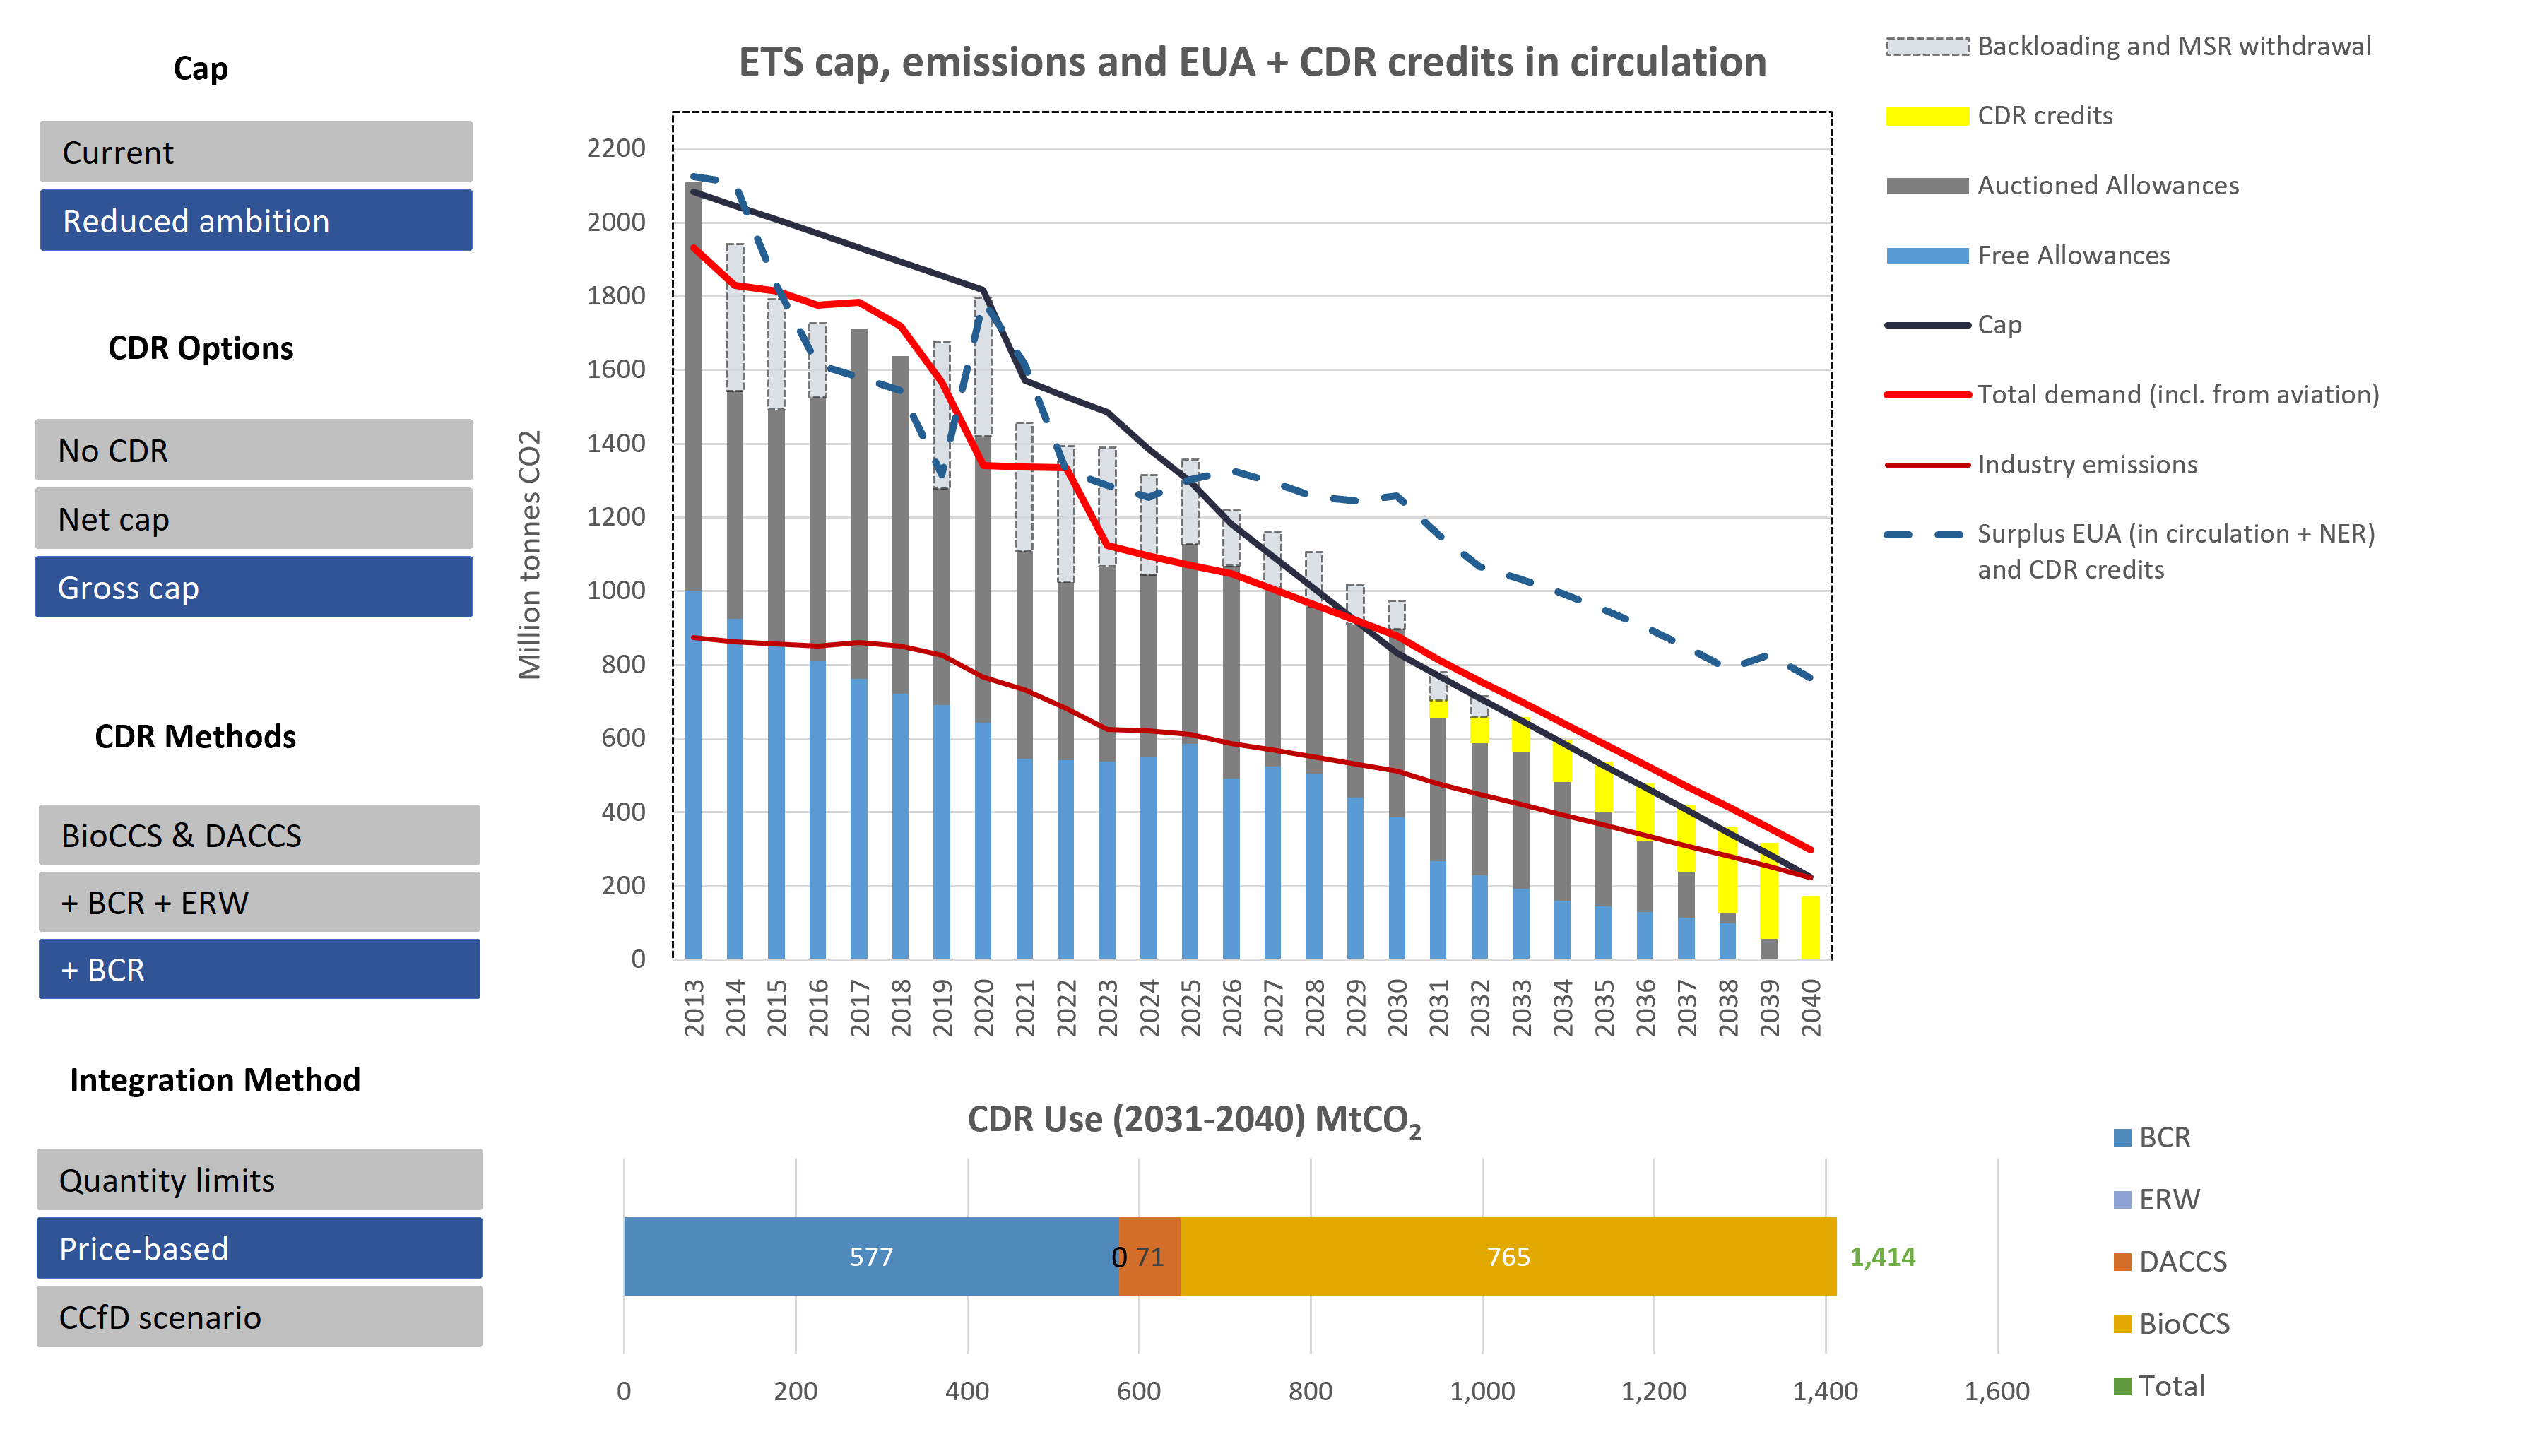
EU ETS + CDR Simulator
Explore how integrating Carbon Dioxide Removals (CDR) affects the EU ETS before 2040.-
Integration scenarios: Analyse how different levels of Carbon Dioxide Removals (CDR) could be integrated into the EU ETS between 2031–2040.
-
Market impacts: Assess the effects of CDR on emissions reductions, allowance supply, surplus accumulation, and overall system balance.
-
Focused approach: Unlike Sandbag’s 2030 ETS Simulator, this model looks specifically at the role of CDR rather than broader sectoral decarbonisation pathways.
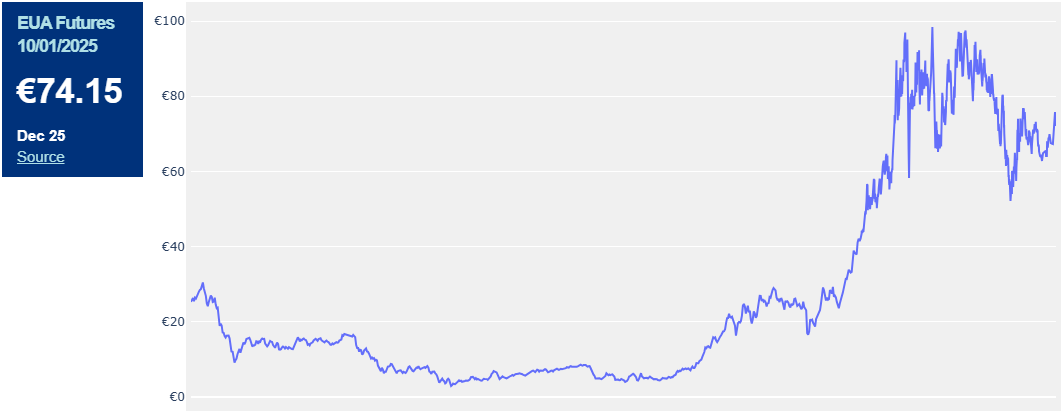
Carbon Price Viewer
Check and analyse the evolution of carbon price over time
- Discover the current cost of emitting one tone of carbon dioxide in Europe.
- Explore the evolution of this price since 2008.
Get involved!
Your support helps us develop tools that enable data-driven and evidence-based climate policies.

WHAT WE DO
TOOLS
PUBLICATIONS
NEWSLETTER
Mundo-b Matogné. Rue d’Edimbourg 26, Ixelles 1050 Belgium.
Sandbag is a not-for-profit (ASBL) organisation registered in Belgium under the number 0707.935.890.
EU transparency register no. 277895137794-73.
VAT: BE0707935890.