
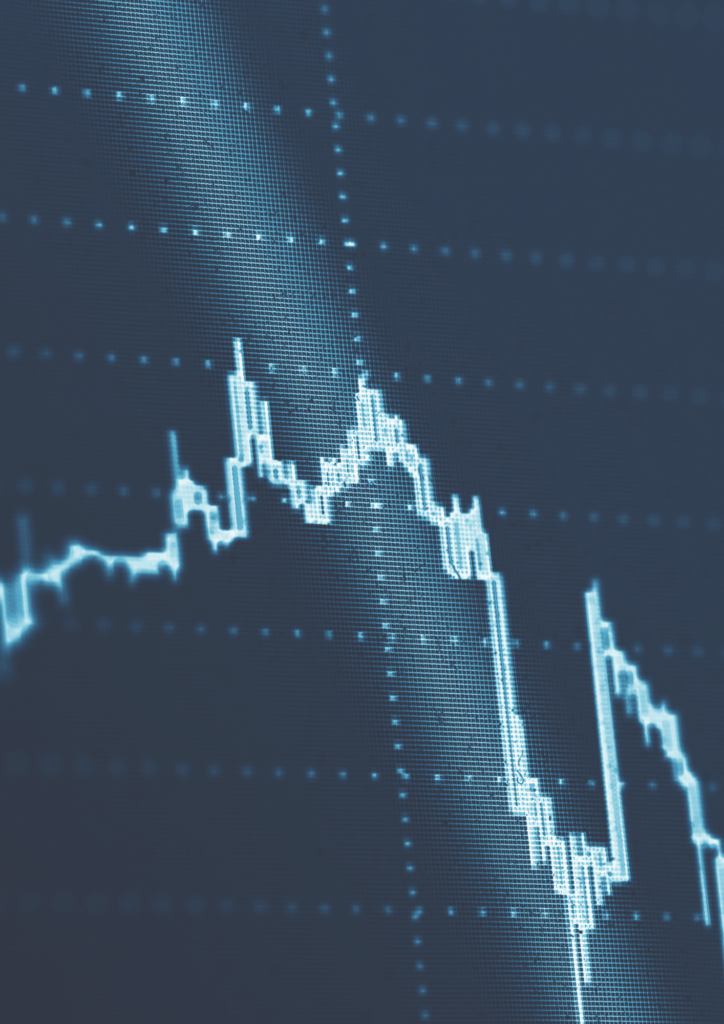
Carbon Price Viewer
Explore historic carbon price trends under the EU Emissions Trading System (EU ETS)This Carbon Price Viewer shows the cost of emitting one tonne of Carbon Dioxide in Europe up to April 2025. While no longer updated, it provides valuable context on how carbon prices have evolved over time.

Questions and answers
How can I use the Carbon Price Viewer?
The Carbon Price Viewer lets you see historical variations in the carbon price since the beginning of the second phase of the ETS in 2008, or over a shorter period by “zooming” into any time interval.
What does the Carbon Price Viewer show?
The Carbon Price Viewer shows the historical price of European allowances (EUA), i.e. the price of emitting 1 tonne of CO2-equivalent for a European industrial installation or airline covered by the Emissions Trading System. It does not mean that this price is always paid by polluters, as many of them receive free allowances.
EUAs are traded between buyers and sellers, either directly “over the counter” or via organised markets. They can be traded either with immediate delivery (spot) or with delivery in the future, usually at slightly different prices. Up until December 2009, the price shown is based on spot-month continuous contract calculation. After that date, it corresponds to auction settlement prices, from the European Energy Exchange AG.
Where does the data come from?
Up until December 2009, the price was sourced from Quandl. Since then, the data has been sourced from ICAP.
Related Publications
Read more about the drivers of the carbon price in the EU ETS in our report on supply and demand in the EU ETS.
Don’t Ruin the EU ETS! Joint NGO Letter to the European Council
Ahead of the March European Council meeting, we’ve joined a group of 35 civil society organisations calling on EU leaders to protect the integrity of the EU Emissions Trading System.
ICC reform and expansion risks diverting ETS revenues from real climate action
Sandbag and 14 other organisations urge the European Commission to reform, not expand, the ETS Indirect Cost Compensation scheme — warning that current proposals risk diverting climate funding into untargeted fossil subsidies.
State Aid for Indirect Carbon Costs: Reform before extending!
Sandbag responds to the EU’s consultation on State aid for Indirect Carbon Costs (ICC), calling for targeted reforms to better support clean electricity, avoid windfall profits, and align with the Carbon Border Adjustment Mechanism (CBAM).
Simulating CDR in the EU ETS: The Risks of Premature Integration
Sandbag has developed an ‘ETS + CDR simulator’ to help visualise and explore the impact that CDR integration could have on the ETS, assess the demand it could create for CDR, and highlight the potential consequences of this demand. This report uses the simulator to explore how different integration pathways could affect emissions reductions, carbon prices, and potentially lead to negative externalities.
The EU ETS at a Crossroads
Sandbag’s latest submission to the EU ETS and Innovation Fund consultation calls for clearer rules on free allocation, stronger criteria for funding innovation, and safeguards against misleading carbon accounting practices.
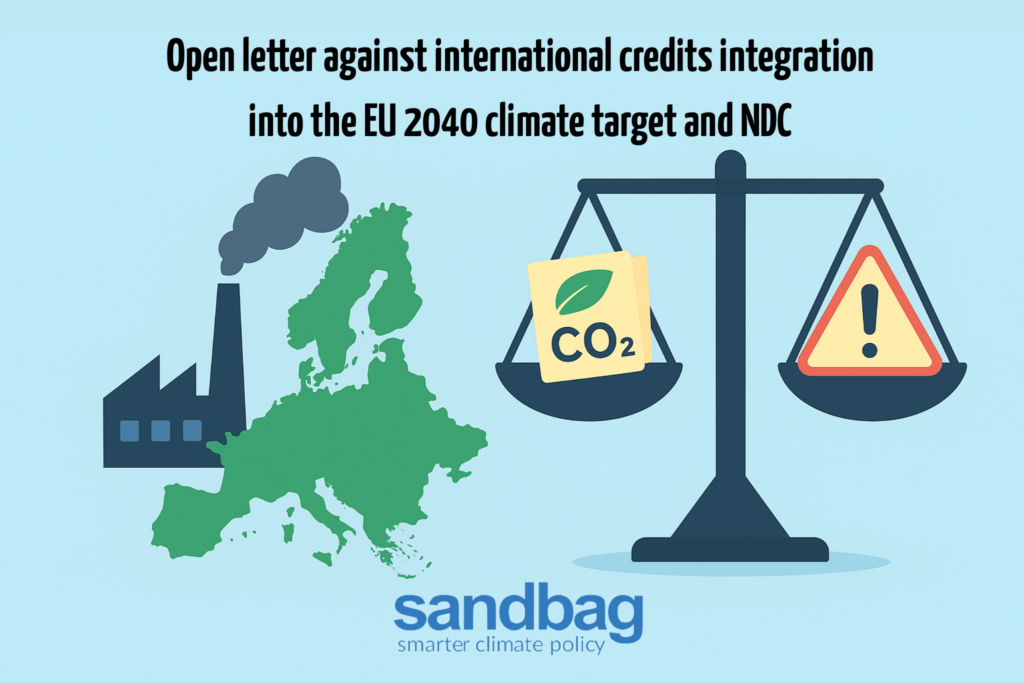
Open letter against international credits integration into the EU 2040 climate target and NDC
A joint NGO letter calls on the EU to exclude international carbon credits from the 2040 target. The signatories urge a domestic-only approach to protect climate credibility and ambition.
In or Out: What’s best for carbon removals and the EU ETS?
What will the future of the EU Emissions Trading System (ETS) look like as the emissions cap heads towards zero? Is integrating carbon dioxide removals (CDRs) into the ETS a solution to help the EU achieve its climate goals? Or would they compromise the integrity and functioning of the system? These questions are at the forefront of the Commission’s mind as they review different options for the future of the ETS ahead of the 2026 revision.
A closer look at 2023 emissions: steelmaking caused a quarter of industry pollution
This brief analyses 2023 emissions under the EU Emissions Trading System (EU ETS), using the latest data available from the EU Transaction Log (EUTL) . It particularly focuses on the iron and steel sector.
Feedback on the inclusion of permanent CCU in the EU ETS
Sandbag urges strict safeguards on permanent CCU within the EU ETS, calling for clear permanence standards, transparent product reviews, and faster removal of free allowances, while stressing CCU must complement (not replace) direct emission reductions.
Supply and demand in the EU ETS: It’s the hydrogen, stupid!
Learn about the supply and demand balance of the EU ETS through the end of its fourth phase in 2030, based on the latest market data and policy parameters. Are the results aligned with the EU's target of a 55% reduction in emissions?

Mundo Matogné. Rue d’Edimbourg 26, Ixelles 1050 Belgium. Sandbag is a not-for-profit (ASBL) organisation registered in Belgium under the number 0707.935.890. EU transparancy register no. 277895137794-73. VAT: BE0707935890