
Overall EU emissions
… are declining, but not fast enough to meet the more ambitious end of our long-term targets of 80 to 95% emissions reductions compared to 1990.
ETS emissions reductions
…are accelerating in the power and heat sector, but industry emissions have been stable in recent years. Aviation emissions are small but growing rapidly. Net demand for EUAs from aviation will continue to increase.
Download the Full Report
The pace of emissions reductions varies hugely
… and unfortunately the most highly emitting member states, Germany and Poland, are reducing emissions most slowly and increasing their share of total emissions. Reliance on coal-fired power generation is the main culprit. The new government in the Netherlands has promised to tackle increasing emissions, with policies including a coal phase-out by 2030.
Coal
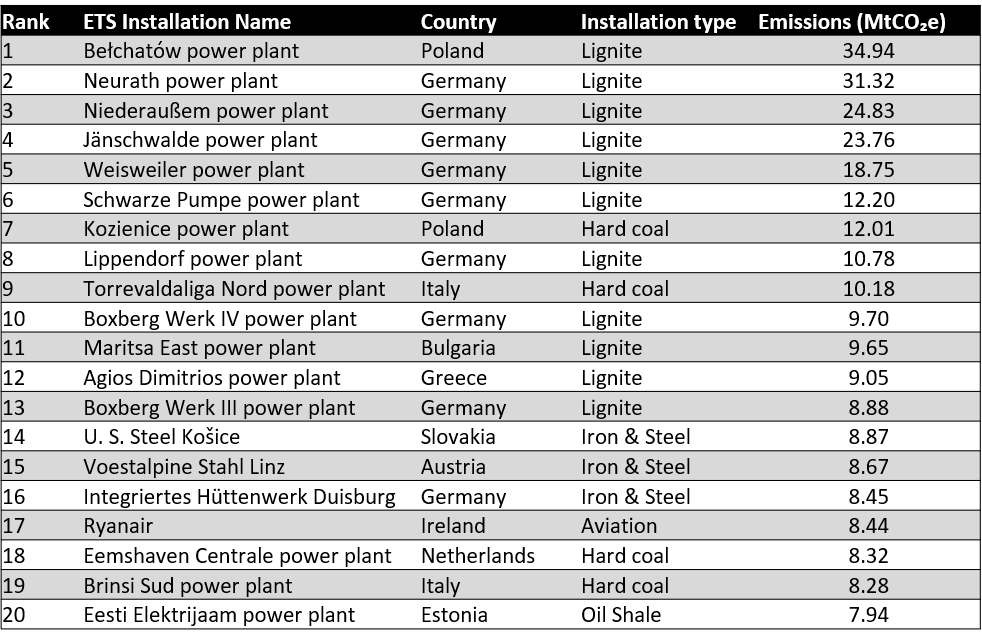
… still accounts for 39% of total EU ETS emissions.
15 of the top 20 emitters are coal and lignite plants; 10 of these are in Germany and Poland.
The increase in renewables has lowered power sector emissions. They have mainly replaced less polluting fossil fuels such as gas, with coal only decreasing slightly since 2013. There’s still a lot of reduction potential in coal. So far, Article 10c allowances have mostly been allocated to coal and lignite installations.
Industry and free allowances
… emissions declined during Phase 2 (2008-12) with the economic crash, but have been fairly stable in the current phase. Reductions have been mainly achieved by lower production, not by reduced emissions intensity, although there are some exceptions (e.g. paper and paperboard and N2O reductions in chemicals). On the current trajectory, our carbon budget will run out long before heavy industry reaches carbon neutrality.
Free allocation is tightening in Phase 3 compared to Phase 2 for most industry sectors, but from 2008-2016, industry’s total potential to monetise oversupply has likely reached a cumulative level of more than €9 billion. The cement and lime sector is the biggest winner.
Germany still receives, by far, the majority of the free allocations. Germany also receives, by far, the largest share of allowances for auctioning.
The ongoing approach for protecting industry sectors from carbon leakage continues to dilute the effectiveness of the ETS as a tool to identify the lowest cost emissions reductions.
The top twenty emitters in the ETS in 2016
Total ETS surplus
… has decreased in recent years (because of the short-term backloading intervention) but at the end of 2016 there is still a huge 1.5 billion surplus. Phase 4 reform measures are insufficient to match supply to demand in the short to medium term. Sandbag expects the surplus to continue, and as discussed previously, this means a significant increase in the carbon price is unlikely.
The Full Report
- The development of the overall supply and demand balance of emissions permits
- Differences in emissions trends between member states and sectors
- Underlying power generation and industry production drivers of emissions changes
- Cumulative potential for monetisation of oversupply for the main industry sectors
- Changes in free allocations as a result of activity level changes
- Auction volume and revenue use across the member states
A separate report examining the future of the ETS will be published shortly.
Published 30th November 2017
For more info contact
tricia@sandbag.org.uk
Methodology - Click to open
Data from the European Environment Agency is used to adjust for scope change between Phase 2 and Phase 3.
Installations are mapped to main sectors based on NACE code (plus other free allocation criteria for power and heat).